September 20, 2022 Market Snapshot
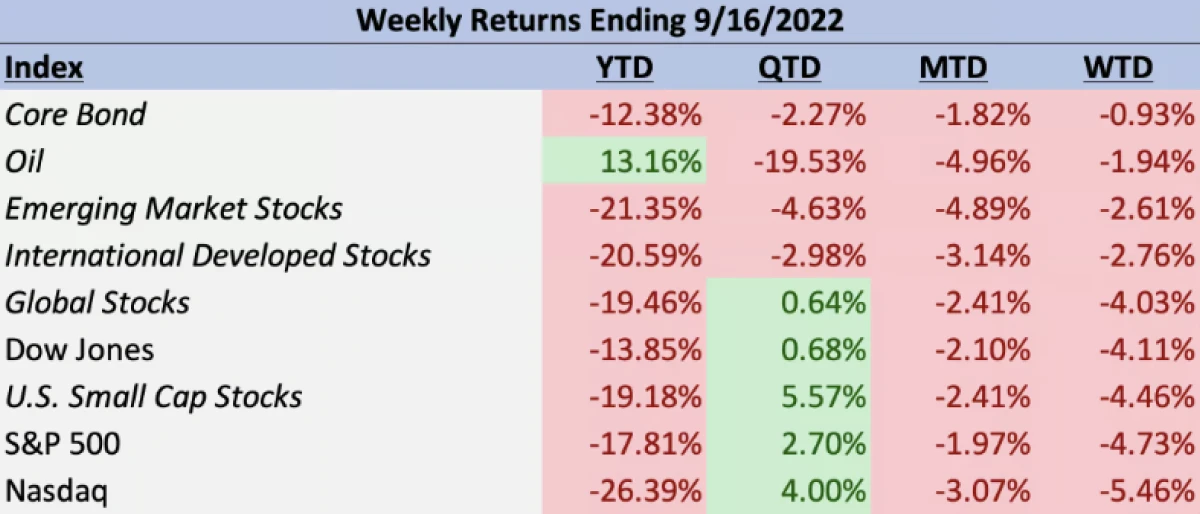
It was a poor week for the stock market, as segments across the board experienced pullbacks. The S&P 500 retreated -4.73% for the week, with the biggest detractors coming from the materials (-6.64%), communications services (-6.42%), industrials (-6.37%), real estate (-6.23%), and technology (-6.11%) sectors. Consumer staples (-3.48%), financials (-3.77%), and utilities (-3.78%) held up better than the S&P 500 as a whole, but still sustained losses. The best sectors for the week were the healthcare (-2.32%) and energy spaces (-2.59%), but these rounded out a week that saw every sector of the large cap stock benchmark fall. U.S. small cap stocks outperformed their large cap peers by a small margin, ending the week down -4.46%. Stock markets overseas showed better results but still saw weekly losses. International developed stocks (MSCI ACWI ex US index) ended the week down -2.76% while emerging market stocks (MSCI Emerging Markets index) outperformed developed markets with a loss of -2.61% for the week. A likely partial catalyst for these losses was a continued rise in bond yields, with the 10-year treasury yield closing at just under 3.45%. The rise in yields coincided with the Barclays U.S. Aggregate Bond Index declining -0.93%.

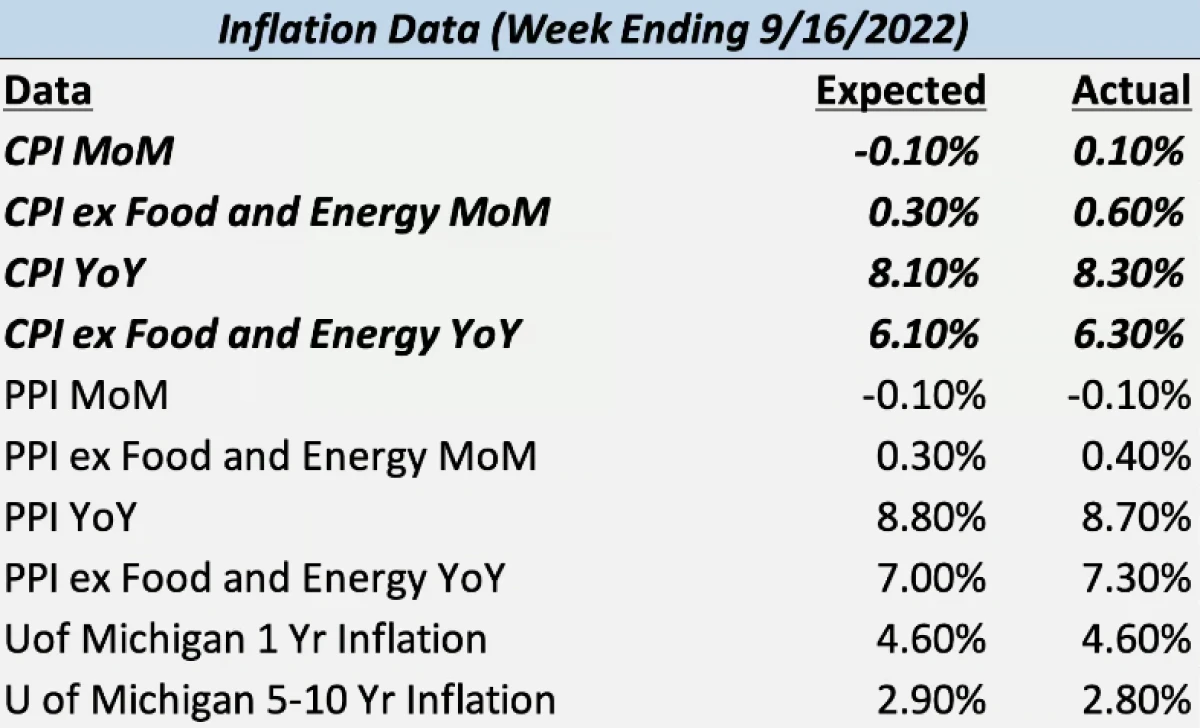
The likely cause of rising bond yields and resulting poor week for stocks was the series of upside surprises in inflation data. In the highest profile reports, those included in the Consumer Price Index (CPI), the actual results were higher than those anticipated by expert consensus estimates and investor expectations.

The good news of a dramatic -10.6% monthly decline in the gasoline component of CPI was more than offset by a monthly rise in shelter, food, and medical care. The steep drop in gas led to energy prices falling -5% for the month overall. When taking a closer look at the underlying month-over-month numbers and focusing in on the less volatile CPI ex food and energy index, market participants were likely concerned by the 0.3% upside surprise over the consensus estimates. Drilling into the details further, inflation in core services outpaced inflation in core goods, and shelter costs (a “stickier” piece of inflation) continued to move higher. Looking at the producer side of the inflation reports (PPI), inflation in this segment came in below expectations on a year-over-year basis and was in-line with estimates on a monthly level. Similarly to CPI, however, PPI ex food and energy rose higher than expected on both schedules.
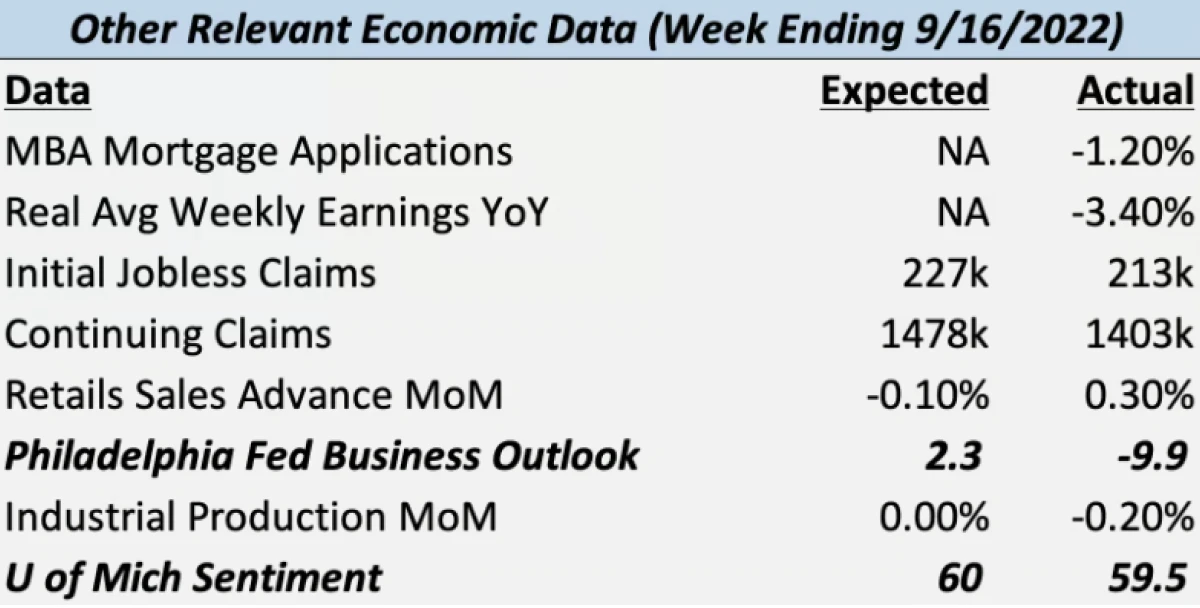
Besides the high-profile inflation data released last week, other economic reports brought additional context to the economic and market picture. Of particular importance were two surveys in the form of the Philadelphia Fed Business Outlook and University of Michigan Sentiment surveys which provide data on the sentiment of producers and consumers, respectively.

On the manufacturing side of the sentiment swings, the Philadelphia Fed survey saw a surprise weakening of current indicators. General activity, new orders, and shipments all declined, with the first two indicators registering negative values. The indicator for employment declined but suggested a continued overall increase. Price increases were reported across the whole of surveyed firms, but the data suggested that price increases are less widespread than in the last month. One bright spot was an improvement in the broad indicators for future activity; these future indicators, however, still pointed to subdued expectations for overall growth over the next six-months.
On the consumer front, the University of Michigan consumer sentiment survey showed improvement in Americans’ confidence in the economy, albeit a rise in the level that was lower than expected. The September sentiment numbers were 1.3 points higher than those in August. More encouraging news was found in the same survey’s evaluation of consumer’s future inflation expectations. Consumers’ 1-year inflation rate expectations fell from 4.8% to 4.6% while 5-10 year expected inflation fell from 2.9% to 2.8%. These levels are still above the Federal Reserve’s inflation mandate but continue to fall away from the survey highs earlier in the year of 5.39% and 3.1%.
The data regarding employment and current consumption has continued to be mostly positive according to last week’s data. Initial jobless claims and continuing claims were lower than the consensus estimates. The advance retail sales data showed a surprise gain month-over-month, together with the previous employment data further bolstering the consumer side of the economic picture. Signs of consumer weakness could be seen in the monthly decline in mortgage applications. The decline of -1.2% represented a fifth straight week of declines. One can see the logic in such a decline given the year-to-date rise in average mortgage rates.
This week will bring another busy week of economic news, with Wednesday’s headliner being the Federal Reserve’s interest rate decision. Interest rate markets (via Federal Funds futures) have already more than priced in a third consecutive 0.75% interest rate hike and the current backdrop of high inflation and still strong overall consumer demand does little to suggest that the Fed will pivot from this decision. Given that this next rate hike decision is most likely priced into the market we have today, what will likely be most influential are the details and tone of Chairman Powell’s following press conference. The expression of his views on that platform will likely immediately impact the market’s views of the direction of rate hikes in the future; currently, the market expects somewhere between a 0.50% to 0.75% rate hike at this year’s November meeting.
Our overall view continues to be that the trajectory of the market for the remainder of the year will be primarily dictated by the path of inflation, investor sentiment regarding the Federal Reserve’s policy direction, and the general health of the underlying economy as it digests these policy actions and supply chain related factors. Geopolitical tensions will continue to be in the picture as well, with escalation or de-escalation being market narrative defining elements.
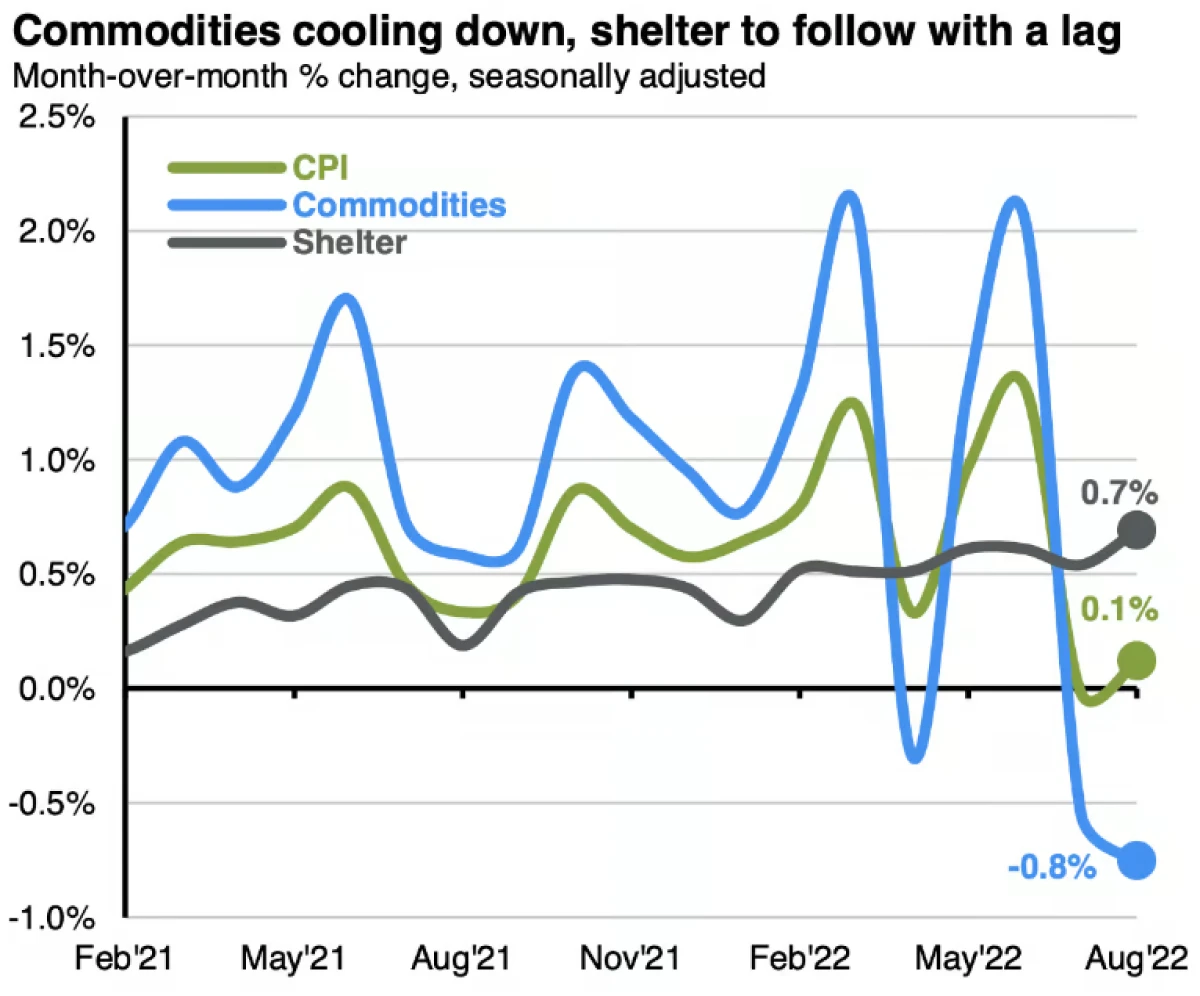
As a final note for this snapshot, and as a potential source of future optimism in the wake of last week’s disappointing inflation news, the chart below (via JP Morgan Asset Management) shows that while food, energy, and other commodities prices had previously been growing faster than the overall CPI index, these components have now finally started to come down. Together, these items account for 40% of the headline CPI basket.

Given last week’s report of the -0.10% decline in PPI, our expectation is that these same disinflationary forces could eventually act in consumers’ favor towards lower CPIs.
Need Some Help?
If you’d like some help from one of our CPAs or CERTIFIED FINANCIAL PLANNER (CFP®) advisors regarding this strategy and how it applies to you, the Rhame & Gorrell Wealth Management team is here to help.
Our experienced Wealth Managers facilitate our entire suite of services including financial planning, investment management, tax optimization, estate planning, and more to our valued clients.
Feel free to contact us at (832) 789-1100, [email protected], or click the button below to schedule your complimentary consultation today.
IMPORTANT DISCLOSURES:
Corporate benefits may change at any point in time. Be sure to consult with human resources and review Summary Plan Description(s) before implementing any strategy discussed herein.Rhame & Gorrell Wealth Management, LLC (“RGWM”) is an SEC registered investment adviser with its principal place of business in the State of Texas. Registration as an investment adviser is not an endorsement by securities regulators and does not imply that RGWM has attained a certain level of skill, training, or ability. This material has been prepared for informational purposes only, and is not intended to provide, and should not be relied on for, tax, legal or accounting advice. You should consult your own CPA or tax professional before engaging in any transaction. The effectiveness of any of the strategies described will depend on your individual situation and should not be construed as personalized investment advice. Past performance may not be indicative of future results and does not guarantee future positive returns.
For additional information about RGWM, including fees and services, send for our Firm Disclosure Brochures as set forth on Form ADV Part 2A and Part 3 by contacting the Firm directly. You can also access our Firm Brochures at www.adviserinfo.sec.gov. Please read the disclosure brochures carefully before you invest or send money.


