Market Recap – June 2024
A Recap Of A Busy Month For Market, Economic, And Political News
Last week saw the end of June and by extension the end of the year’s second quarter. It was a busy month for market, economic, and political news, with the month’s finale signaling the year’s full transition into Presidential campaign season through the first Presidential debate. The “made for TV” debate has garnered plenty of attention; but the month has also moved investors’ lenses towards what may be a less flashy but equally (if not more) important set of debates from the perspective of markets.
The topics in these debates include where we are in the fight against inflation, can economic growth and the labor market maintain their strength, if the Fed is finally in a position to cut interest rates by 2024’s end, and if the market’s rally can broaden out and continue producing strong gains in the latter half of this year. We will provide some brief commentary from a market centric point of view on the Presidential election, but the focus of this newsletter will be on these more economic and market centric topics.
Market Summary
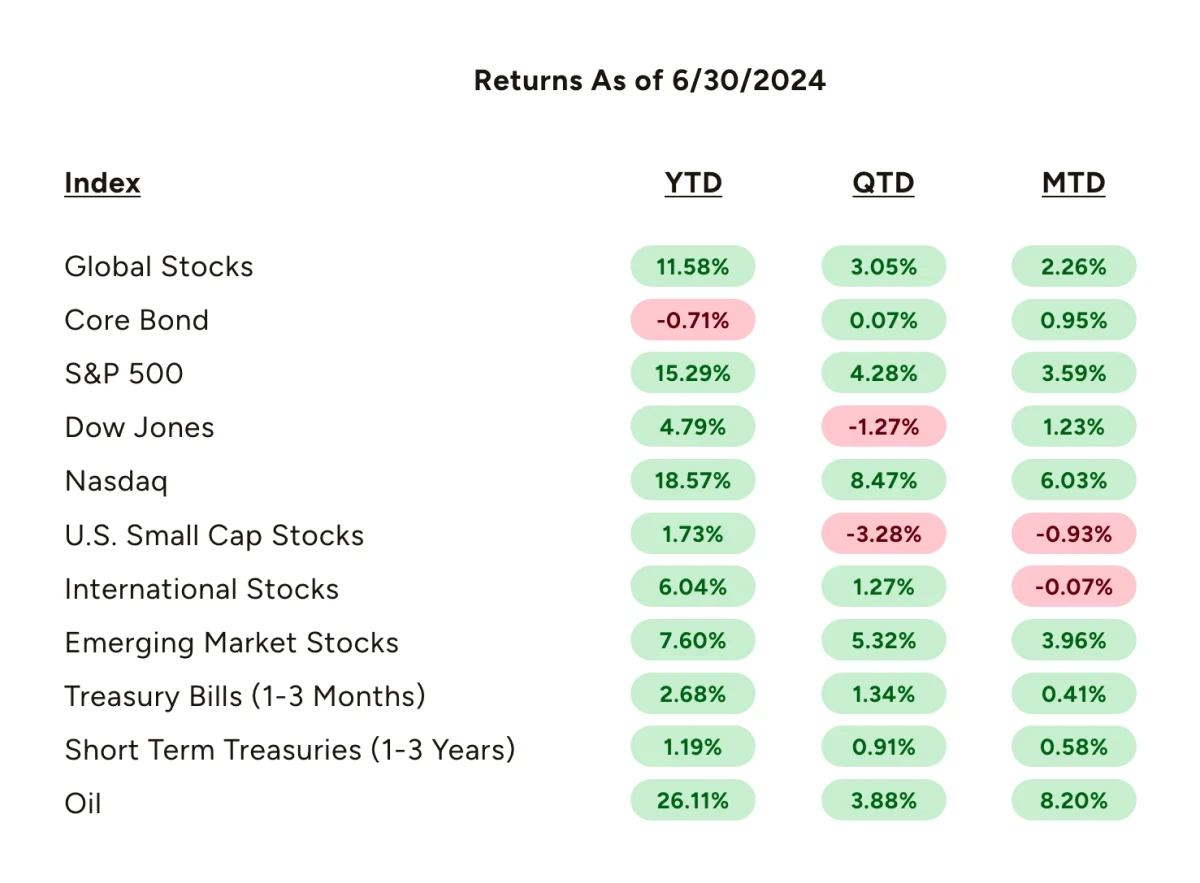
The month of June was essentially emblematic of what market participants have observed throughout the first half of this year. That being a notable dispersion of returns in the stock market depending on the index, asset class, and sector viewed.
While most segments have produced positive returns year-to-date, the magnitude to which they’ve performed has varied significantly.
Perhaps most representative of this dispersion is the difference between U.S. large cap stocks and small cap stocks; the S&P 500 (at the end of June) has returned over 15% YTD while the Russell 2000 (the small cap index) has returned a much more modest 1.7%. For the month of June, small cap stocks were down nearly -1% while the S&P 500 rose nearly 3.6%.
This disparity isn’t limited to the relative outperformance of large caps to small caps, it is also seen among large caps themselves on both a sector and individual stock level.
On a sector basis for the year, the technology and communication services sectors have significantly outperformed the broader S&P 500 index, producing returns of roughly 28% and 27% respectively. The remaining sectors have underperformed, with real estate being the biggest laggard having lost -2%. In the month of June alone, technology was up over 9%, beating the biggest laggard in utilities (~-5.5% for the month) by over 14.8%.
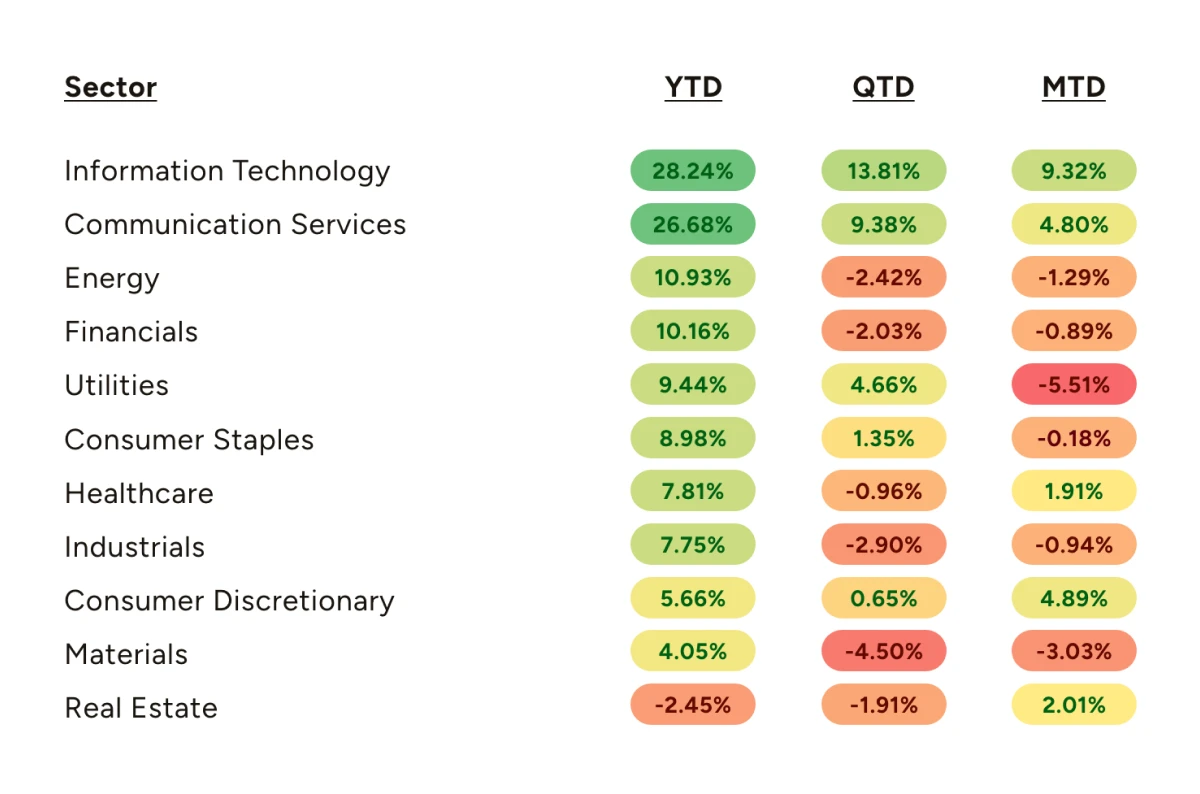
Further reinforcing this narrative of “narrow” market participation has been the story of the group of stocks known as the “Magnificent 7” versus “everything else”. It is no coincidence that the seven names in the collective are predominantly made up of the aforementioned information technology and communications services sectors. Of the group (Microsoft, Amazon, Meta, Apple, Alphabet, Nvidia, and Tesla), only Tesla and Amazon are outside of the sector pair (being in the consumer discretionary sector).
The Magnificent 7 has returned nearly 37% year-to-date compared to ~15% on the S&P 500.
If one removes the Magnificent 7 from the index entirely, the market has returned a still strong but less impressive 8.28% for the year. As a final way to evaluate the skewness of returns, if one were to “reweight” the S&P 500 by shifting it from a “market cap weighted index” (with the largest companies receiving higher weights and small companies holding lower weights) to an “equal-weighted index”, the S&P 500 in this configuration is up just 5.07% year-to-date.
On a regional basis, the U.S., largely due to sector exposures (more tech and communications services) and the Magnificent 7’s contribution, has continued to outperform its international and emerging market counterparts. Year-to-date, international stocks and emerging market stocks are up ~6% and 7.6% respectively. However, sector and company exposures only explain part of the story.
Another driving factor in the U.S.’s outperformance has been the strength of the dollar. After falling from a high of 107 last October to 101 at the end of December, the U.S. Dollar Index (which indicates the general international value of the dollar through averaging exchange rates) has rallied significantly and ended June at nearly 106.
Given the US dollar is the world’s reserve currency, global investors express international indices (such as the ones we reported) in dollar denominated terms.
If one were to look at the returns of the reported indices in terms of their local currencies (hedging out the impacts of conversion to US dollars), the returns for the year look better in comparison, with international stocks rising ~11.4% and emerging markets returning 11%. The difference between these “hedged’ and “unhedged” index returns showcase the tremendous headwind the strengthening dollar has placed on international markets relative to those in the United States.
While the debate over what exactly influences exchange rates continues to be active and disputed, the most common explanation is tied to inflation expectations, budget deficits, and countries’ relative interest rate differentials. The question of where the Federal Reserve is in its monetary policy stance in comparison to other major global central banks is of significant interest to the latter factor, and one which we will assess further in this newsletter.
June saw the 10-year treasury yield make a “round-trip” of sorts, with the benchmark bond yield falling in the aftermath of a promising CPI report and then proceeding to rise once again after a second inflation report (the Fed’s preferred measure PCE) released in line with expectations.
The 10-year yield ended the month lower at ~4.4% (started the month at ~4.49%) but was well off its monthly low of sub 4.2%. The Barclays Aggregate Bond index continues to be lower YTD at -0.71% while higher starting yields for the year continue to benefit the shorter end of the curve.
Market Valuations and Earnings
When examining the overall market environment of returns for the first half of 2024, it’s understandable that investors may be feeling the natural urge to “chase the herd”. With core bonds lower, small cap and international equities trailing, and the bulk of large cap stock performance being concentrated among a smaller subset of companies, diversification in the classic sense has led to suboptimal short-term results year-to-date.
While we don’t believe that the Magnificent 7 is in a bubble, such as that seen in the dot com internet stock crash of the early 2000’s, it is important for investors to look at valuations when considering forward-looking returns. Valuations, while not the driving factor of stock returns on a short-term basis, still matter for long-term investors.
As the table shows below, valuations for the Magnificent 7 stocks widely vary both among their peers and in relation to the broader market from the perspective of several trailing multiples (EPS, Cash Flow, Sales, and EBITDA). In these multiple terms, the Magnificent 7 is relatively more expensive than your average large cap stock and small cap stocks.
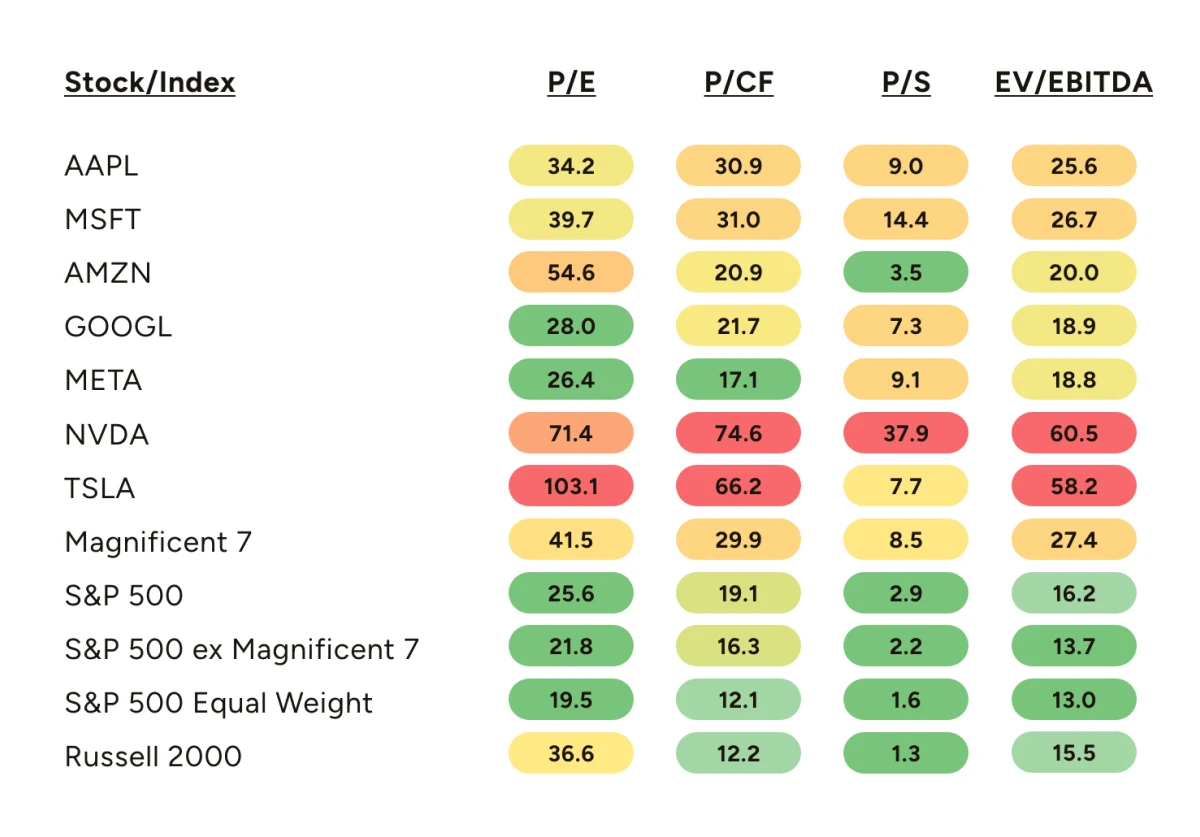
Of course, valuation is not the only thing that matters for long-term investing, companies with strong business models generating resilient earnings warrant a higher multiple (whether P/E, P/CF, etc.) than those that do not. Over the past several quarters, the Magnificent 7 has generated a significantly stronger level of earnings growth than that of the broader market, and the companies in that group that generated those earnings earned strong returns during this period.
However, outsized earnings growth does not often last in perpetuity (often due to rising competitive pressures, growth in alternatives/substitutes, and shifting consumer tastes) and there is reason to believe that some level of convergence is in order. The following graph shows the estimated level of year-over-year earnings growth (from consensus analyst expectations) through the end of the year compared to that seen since 2022.
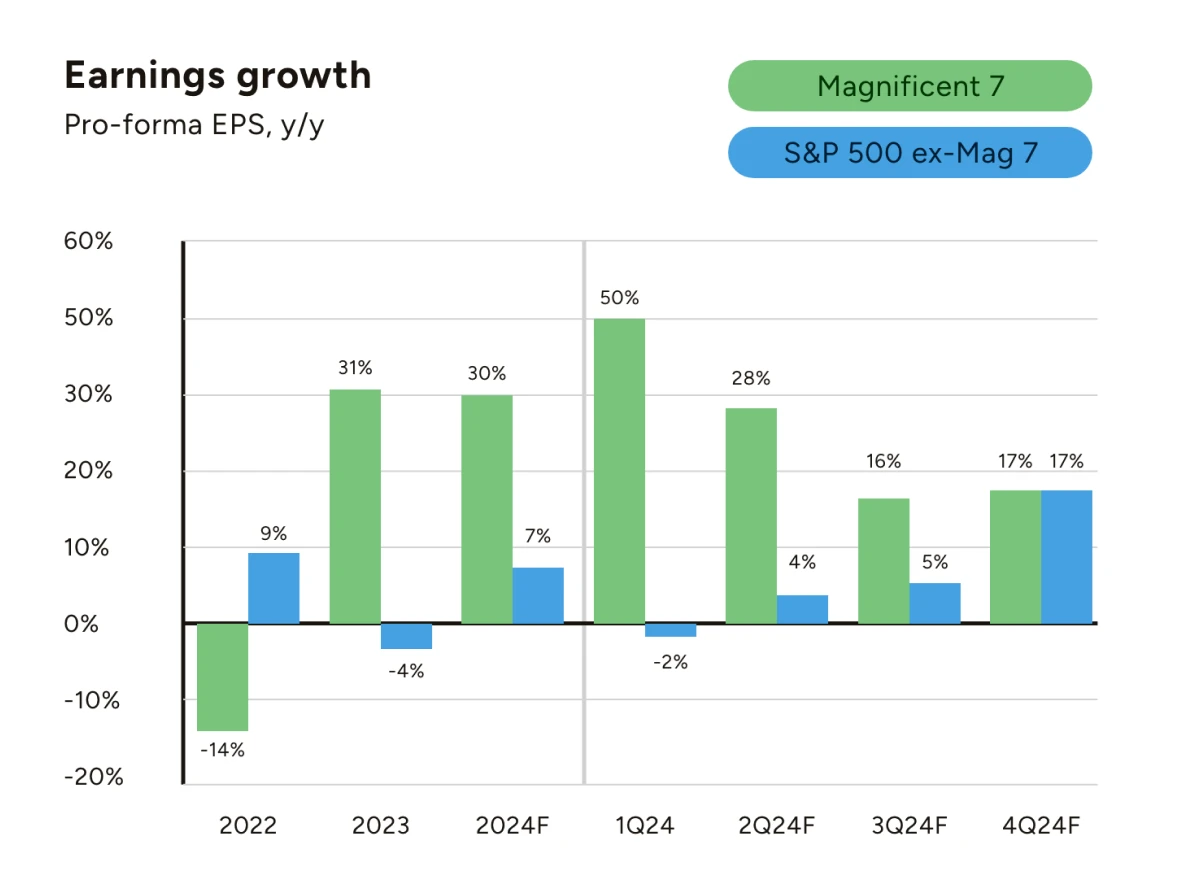
JP Morgan Guide to the Markets
The takeaway from these estimates is that the Magnificent 7’s earnings growth is expected to slow and then stabilize from their impressive heights while the remaining companies are set to accelerate. A shift in favorability of previous periods’ comparable reporting will certainly play a factor, but a shift in the macroeconomic environment may be a key catalyst as well.
Strong cash flow generation and quality balance sheets have been a protective moat that investors have favored in a higher inflation and rising interest regime. The possibility for cooling inflation and interest rate moderation should stand to benefit those companies more susceptible to restrictive economic pressures. This does not mean that the Magnificent 7 will not participate in what we expect to be the new economic backdrop, but we do believe diversification will benefit from a broadening out of returns.
Economic Update
The first step towards reaching our broadening out thesis is a resumption in a downward trend in inflation; a prerequisite for a soft landing.
June saw three sets of inflation reports with two of them providing what amounted to unambiguously good news.
The Consumer Price Index (CPI) reports saw a sweep of lower-than-expected inflation numbers from May. The month saw overall headline CPI flat for May (0.1% exp) while CPI ex food and energy increased just 0.2% (0.3% exp). The year-over-year reports were similarly rosy with headline CPI up 3.3% (3.4% exp) and core CPI up 3.4% (3.5% exp).
It was the first time that headline CPI was at 0% month-over-month since last October and a continuation to new lows in year-over-year core CPI in this inflationary cycle (since 2021).
The following day brought the release of the Producers Price Index (PPI) report, which brought additional evidence of softening inflation. PPI ex Food and Energy was flat over the month while overall PPI fell -0.2% over May; both firmly beat the estimates of 0.3% and 0.1% growth respectively.
Bond yields predictably fell after the news, as the market moved expectations for interest rate cuts from ~1.56 to ~2.01 by year’s end; with 65.5% of a cut in September.
The final day of the quarter saw the release of the third set of inflation reports in the form of the Fed’s preferred measure, the Personal Consumption Expenditure deflator (PCE). Perhaps the market’s expectations had moved too dovish.
While the reports across all periods and variations (headline, core, monthly, and yearly) were in line with expectations, bond yields proceeded to move higher following their release. As of July 2nd, the market now expects 1.84 cuts by the end of the year with a 65.5% chance of a cut in September.
The numbers from the PCE reports were in a vacuum well improved from April’s data. Core PCE was up 0.1% in May and 2.6% year-over-year. Both represent a continued trend of cooling inflation, with the monthly figure of 0.1% amounting to an annual rate of just 1.2%.
What makes this most recent turnaround in the inflation data more compelling is that the index’s most stubborn component continues to be an adverse factor. Shelter (or owner’s equivalent rent specifically) continues to be high, with rent of shelter rising 0.387% month-over-month (a 4.64% annual rate) and contributing 0.14 points to the overall CPI number.
With a nearly 22% weighting associated with the metric relative to inflation, expectations for shelter costs to decelerate in upcoming reports suggest that additional cooling inflation could become a trend going forward.
While the inflation data received was a nearly unanimous point of optimism for investors and economists, the labor market provided mixed results. Early June saw May’s unemployment report show a small increase in joblessness from 3.9% in April to 4.0% (3.9% exp). Despite the increase in the unemployment rate, one would be hard pressed to describe this as a substantial enough deterioration of the overall labor market to cause alarm.
Change in nonfarm payrolls and private payrolls both saw large beats with 272k and 229k jobs added (vs 180k and 165k expected respectively). However, new evidence is emerging that the labor market is cooling from the hot job market that fostered inflationary wage pressures the past two years.
The first week of July provided the JOLTS Job Openings report, and while the survey saw an increase in openings to 8.1 million (7.9M exp), the key observation gleaned from the data was in the form of ratio of vacancies to unemployed workers. The ratio, which has been in a falling trend since March 2022, has reached its pre-COVID level.
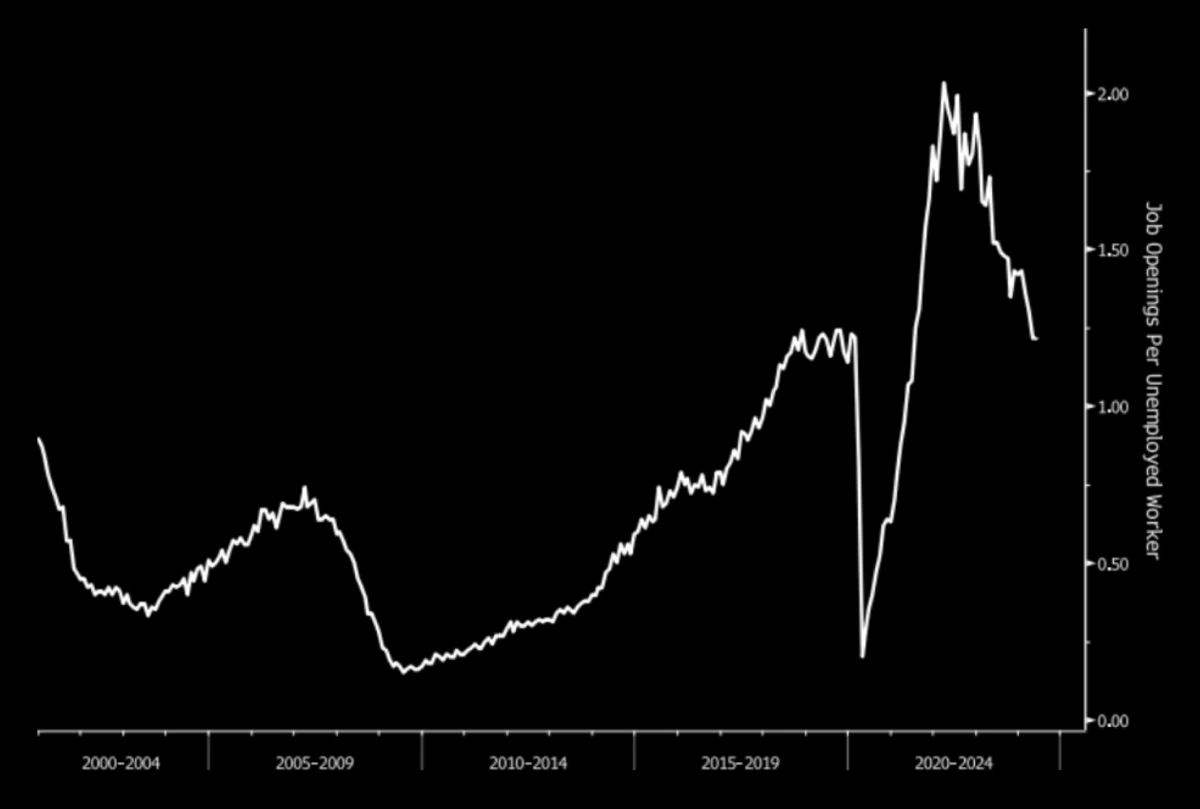
Bloomberg: Openings per Unemployed Worker
Less workers are switching jobs, seemingly less confident in gaining higher wages with the quit rate at 2.2%, which is below the pre-pandemic level. Further evidence emerged on Wednesday through the private payrolls data (ADP Employment Change), which came in well below the estimated 165k jobs added at only 150k. This was also a slowdown from the 157k jobs added in May.
The end of July will provide the advanced release of second quarter’s GDP, the premier gauge for the country’s level of economic growth. June’s Purchasing Managers Indices (PMI, referencing May), point to an economy that continues to be in expansion overall but with services continuing to buoy the economy.
Wednesday’s ISM Services PMI index showed a surprise reversal in the first glimpse at data for June, with the Services Index decelerating from the prior months 53.8 (above 50 is considered expansion) to an actual contraction of 48.8.
Given that consumption is the largest contributor to GDP in the United States, the May data for retail sales (released in mid-June), provided additional evidence that the economy is feeling the pressures from the Federal Reserve’s monetary tightening efforts.
Retail sales grew below economists’ estimates on a month-over-month basis at 0.1% (0.3% est.). When removing auto and gas consumption, the figure also grew 0.1% versus the expected 0.4% growth.
Federal Reserve Policy
With inflation continuing to slow, indicators for economic growth cooling, and the labor market showing signs of reaching equilibrium, signs appear to be pointing towards a shift in the Federal Reserve’s monetary policy approach at some point this year.
The Fed’s preferred measure of inflation, core PCE, has slowed 3 months in a row and decelerated on an annual basis in the latest release for the first time this year. The debate among Fed officials heading into their meeting at the end of the month will likely be on exactly how cautious they should be in balancing the optimistic inflation data and the recent evidence that the labor market is beginning to feel the strain of restrictive interest rate policies.
The market is expecting a shift towards dovishness from the Fed. Compared to the latest interest rate dot plot of projections that the Fed released in its June meeting, Fed Funds futures markets are pricing in closer to two cuts than one (the Fed’s projection) by the end of the year.
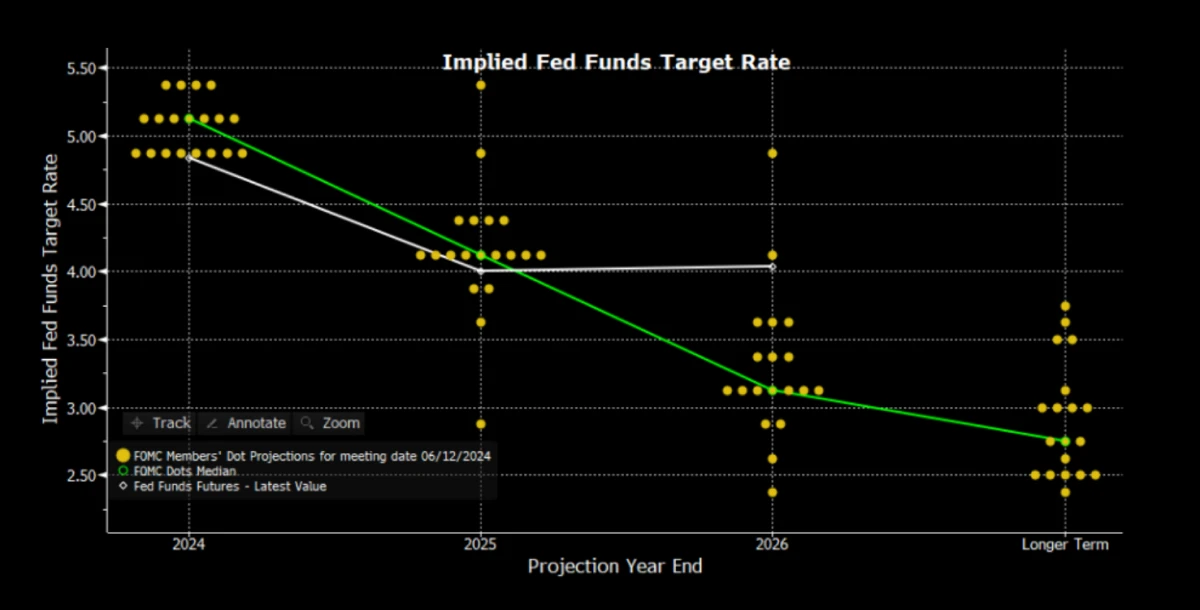
Bloomberg: Fed Dot Plot Projections versus Current Fed Funds Futures (7/3/2024)
At this point, there has been very little evidence from Fed Officials’ comments that they are convinced inflation is at a point where interest rate cuts can occur.
Earlier this week at a European monetary policy conference in Portugal, Chairman Jerome Powell provided commentary that admitted the U.S. is back on a “disinflationary path”, but that more data was needed to verify that the softer inflation readings are accurately representative of the economy. Given these comments and the Fed’s cautious approach thus far, it appears unlikely that an interest rate cut is inevitable in the July meeting, which leaves the three remaining meetings (September, November, and December) as the candidates for a reversal in policy to occur.
The market’s expectations are for September to be the most likely timing of the first interest rate cut.
Global central banks outside the U.S. have already started cutting; the European Central Bank and Bank of Canada both cut rates in June and are expected to continue cutting throughout the year. Given global currency exchange rate markets are believed to be impacted by expected interest rate differentials (with the dollar providing evidence of this from its year-to-date rise in strength), there could be some additional pressure for the Fed to follow suit heading into the rest of the year.
A continuation of inflation reports along the recent cooling trend will be of great importance for both markets and the economy leading up to a July meeting that could see the Fed move its statements towards additional confirmation of inflation reaching a point of satisfaction and a September meeting that could see its first interest rate cut. This is the scenario we see as most likely to play out.
Notes on the Election and Conclusion
The debate among Fed officials will be an important one for markets, but the debate receiving most of the spotlight in the last week was the first Presidential debate between President Joe Biden and former President Donald Trump. The debate itself did not bring any market moving surprises.
More polls will emerge in the coming days and weeks that will provide additional evidence as to whether the debate shifted voter opinion in a meaningful way. It is important to note that research on exactly how influential they are historically is mixed.
We will save a deeper examination of any potential policy ramifications that could be on the line for a later time, but for an election year it has already been an eventful one for markets but not in the way many investors may have expected going into the year.
Investors often have some angst when it pertains to their return expectations for markets during election cycles. Politics are an inherently partisan topic and our personal ideals can create biases in how we interpret the world, which when considering markets can lead to unexpected and even detrimental outcomes.
2024 has been the fourth best start to a year for stocks during an election year. While volatility can exert its influence at any time and disrupt the trend, stock momentum has historically continued its positive start in election years.
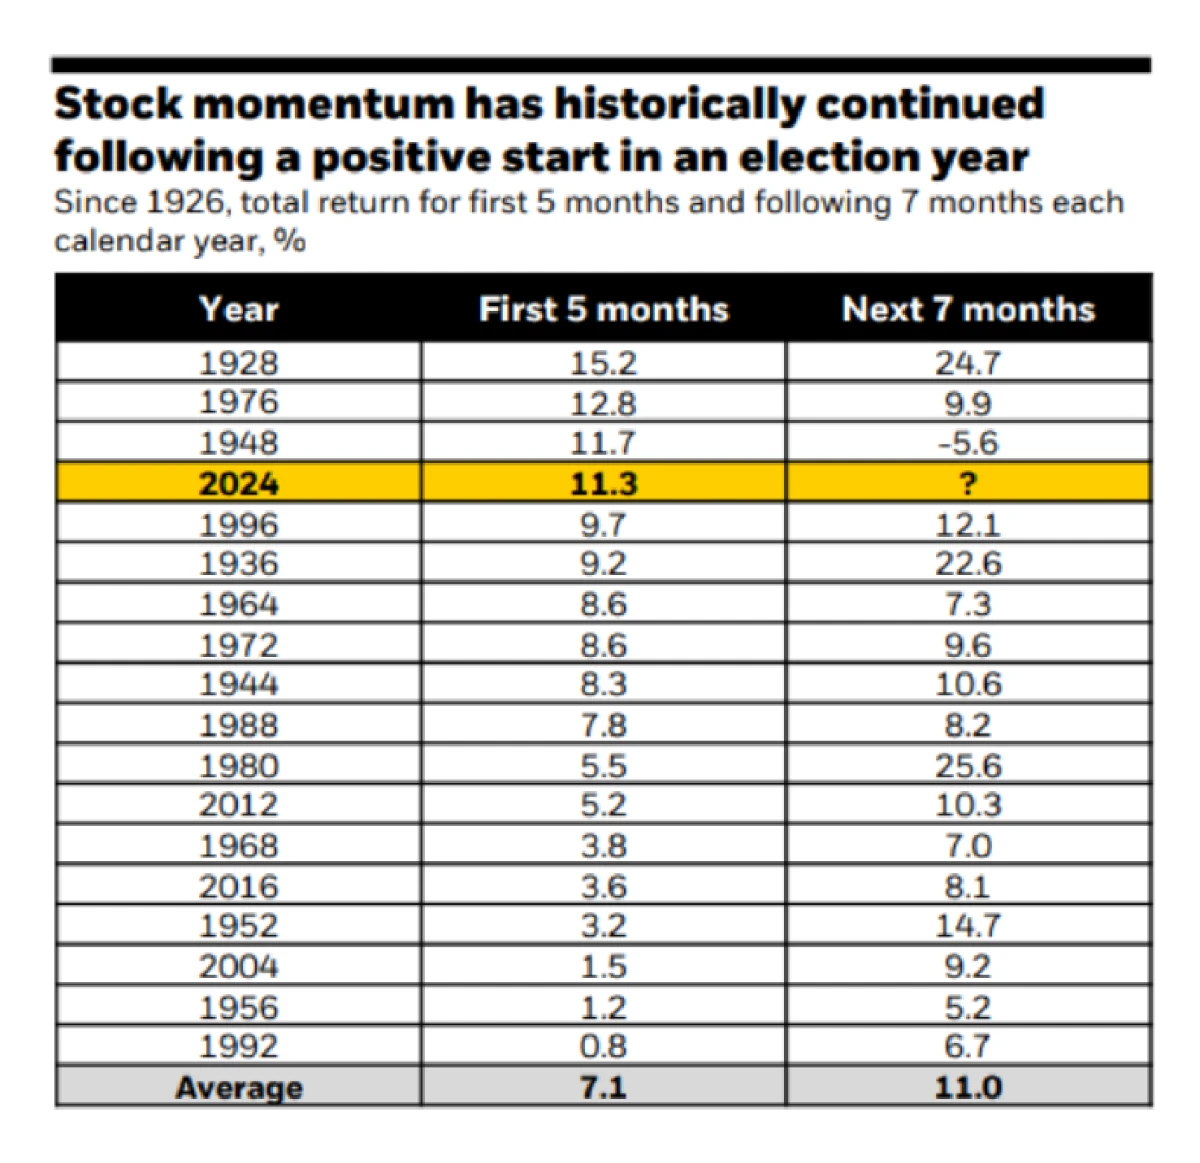
BlackRock Student of the Market June 2024 (as of 5/31/2024)
When considering the overall economic environment, we continue to believe that a soft-landing is the most likely outcome. For the economy this projects to an environment where inflation continues to decelerate, the labor market reaches a point of equilibrium, and economic growth stabilizes to normalized levels.
This backdrop would support conditions that promote corporate earnings growth and equities providing more broadly positive returns. With interest rates off their peaks, fixed income markets should produce income while reducing volatility in balanced portfolios.
The most prominent risk remains whether the Fed maintains a hawkish stance for too long out of an abundance of caution in the fight against inflation. A surprise resurgence of inflation would be a less likely but hazardous setback to this framework that could bring out the risk of volatility.
The geopolitical climate will continue to be an area we watch closely. Despite these risks, the constructive economic developments and resilient corporate earnings growth leads us to a cautiously optimistic view towards markets heading into the year’s second half.
Need Some Help?
If you’d like some help from one of our CPAs or CERTIFIED FINANCIAL PLANNER (CFP®) advisors regarding this strategy and how it applies to you, the Rhame & Gorrell Wealth Management team is here to help.
Our experienced Wealth Managers facilitate our entire suite of services including financial planning, investment management, tax optimization, estate planning, and more to our valued clients.
Feel free to contact us at (832) 789-1100, [email protected], or click the button below to schedule your complimentary consultation today.
IMPORTANT DISCLOSURES:
Corporate benefits may change at any point in time. Be sure to consult with human resources and review Summary Plan Description(s) before implementing any strategy discussed herein.Rhame & Gorrell Wealth Management, LLC (“RGWM”) is an SEC registered investment adviser with its principal place of business in the State of Texas. Registration as an investment adviser is not an endorsement by securities regulators and does not imply that RGWM has attained a certain level of skill, training, or ability. This material has been prepared for informational purposes only, and is not intended to provide, and should not be relied on for, tax, legal or accounting advice. You should consult your own CPA or tax professional before engaging in any transaction. The effectiveness of any of the strategies described will depend on your individual situation and should not be construed as personalized investment advice. Past performance may not be indicative of future results and does not guarantee future positive returns.
For additional information about RGWM, including fees and services, send for our Firm Disclosure Brochures as set forth on Form ADV Part 2A and Part 3 by contacting the Firm directly. You can also access our Firm Brochures at www.adviserinfo.sec.gov. Please read the disclosure brochures carefully before you invest or send money.


