Market Update – April 2024
An Update On The Stock Market, Economic Conditions, and Geopolitics
April has seen the market cooling off from what has been a rapid rally since last October feeding into 2024. Following a 10.5% run in the S&P 500, the large cap stock index has slid just over -3% as we reach the closing stretch of the month. While global stocks remain close to 5% higher year-to-date, investors have seemingly turned more cautious in the aftermath of several developments across the geopolitical and economic landscape.
Market Summary
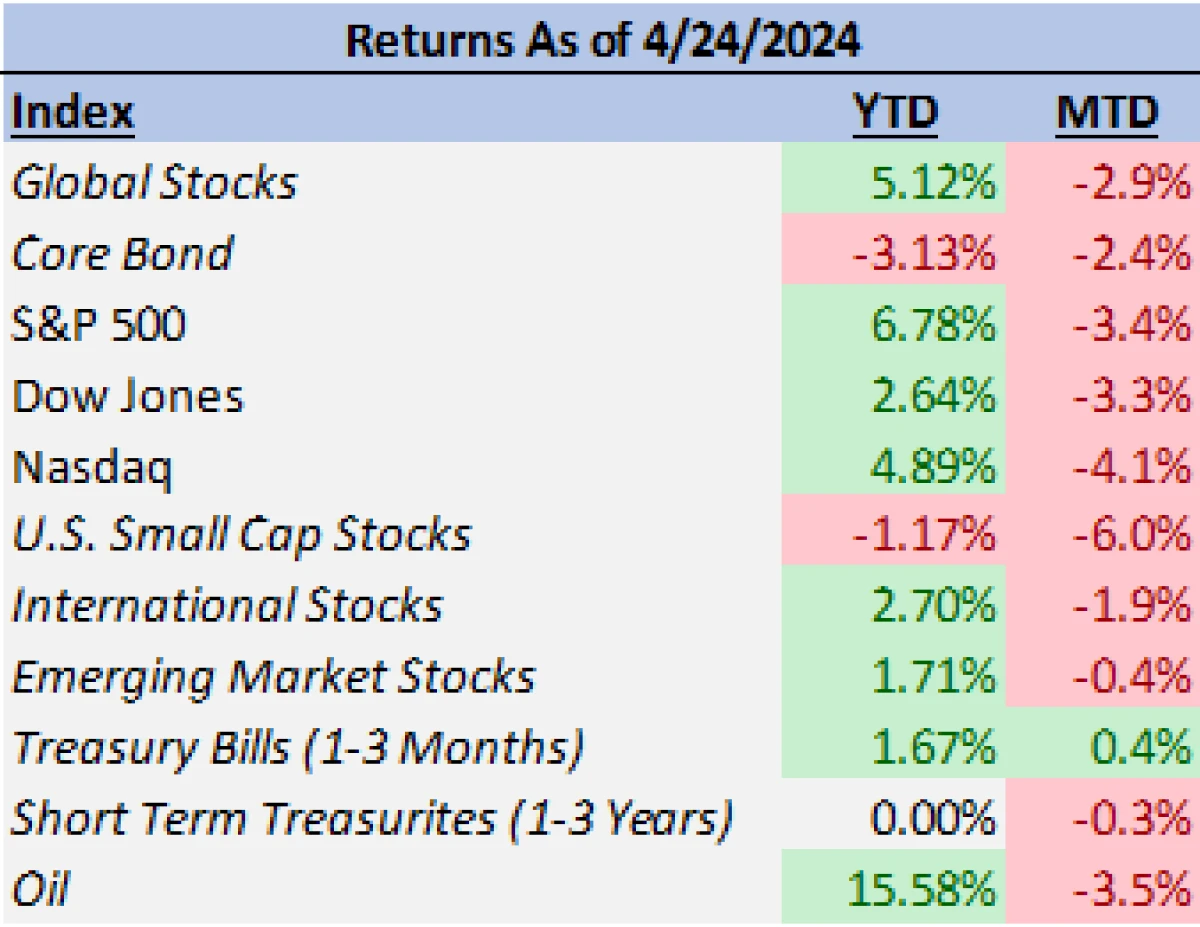
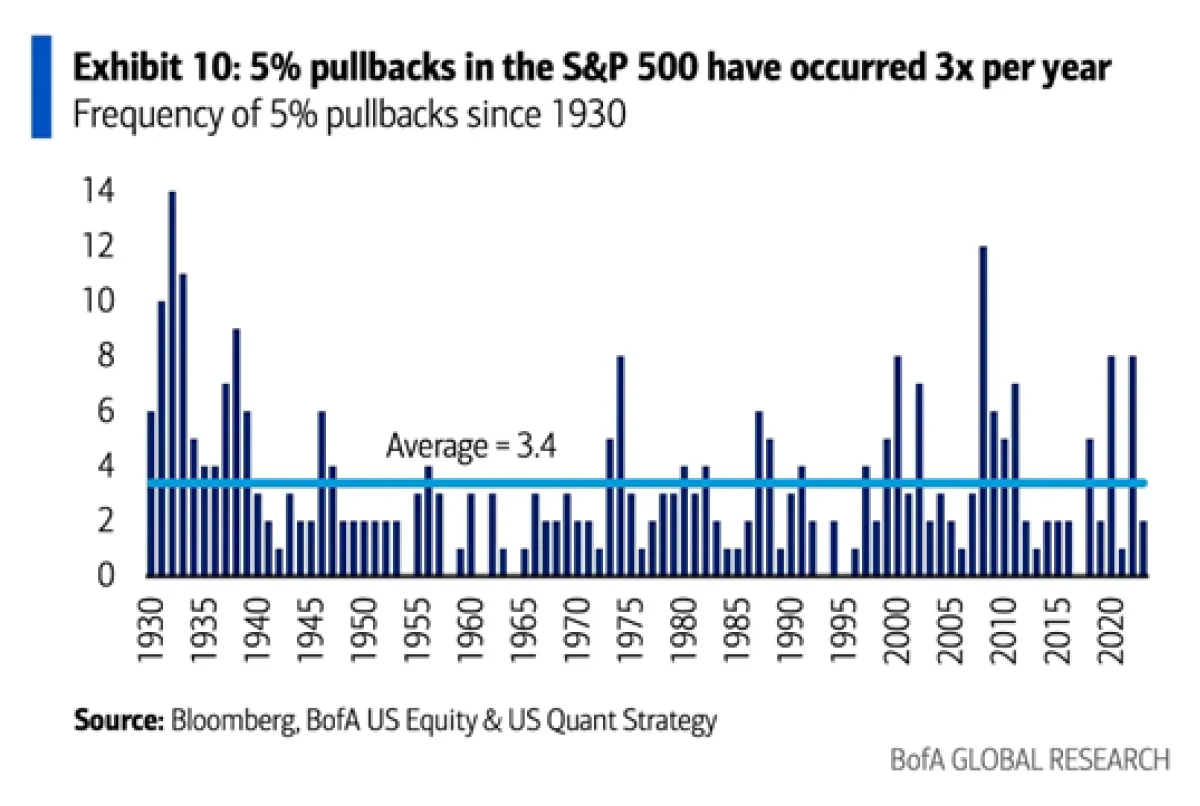
Escalating tensions in the Middle East, reconsideration of the Fed’s near-term interest rate policies, and recently stubborn inflation have all contributed to the market’s recent pullback. Market participants would be wise to put the recent volatility into context, as history shows that 5% pullbacks in stocks are not only something investors shouldn’t be alarmed by but are in actuality quite common.
Beyond the S&P 500, other parts of the market (such as small caps, off -6% from their highs), have seen more volatility since that March 28th peak, but each of these movements are well within the realm of normal market volatility to date.
Market declines of 5% have occurred an average of three times per year since 1930. Legitimate corrections (between 10% and 20%) have occurred on average every two years since 1980.
Markets have recovered from most 5% pullbacks with ease (and of course all of them with time), and even deeper drawdowns do not guarantee a negative year for returns. In 14 of 22 times (64%) since 1980 where the market did experience a double-digit decline, the market ended the year with a positive return.
At this point, we do not anticipate a deep correction in the stock market. Earnings estimates for the coming year continue to show expected strength and consumption continues to show little evidence of slowing significantly. Forward 12-month earnings on the S&P 500 are estimated to grow 9% through next year (next four quarters) and nearly 12.8% in the period following.
Outside of the geopolitical tensions in the Middle East, inflation has been the second story driving volatility. We continue to believe that the current level of tightening from the Fed will be sufficient to slow the economy from its above trend growth rate to a point where moderate sustainable GDP, deceleration in inflation, and the path towards lower interest rates can be reached.
Geopolitical Impact
Our view of the conflict in the Middle East from an investment perspective has been that of the market’s to this point. One of caution but not panic, with a key emphasis on paying attention to quality information and looking towards market history and current fundamentals as an aid in navigation.
While the back-and-forth direct strikes between Israel and Iran have rightly concerned the world, as they do certainly represent an escalation from the “proxy war” that has been fought for generations, the actual level of escalation and fundamental impact on the economy and market is the important question needing answered from an investment perspective.
The key word that we’ve seen used to describe both the Iranian and Israeli strikes is “limited”. For the initial Iranian rocket and drone barrage launched two weeks ago, the “limit” appears to have been in the target, magnitude, and choice of weaponry.
Although largely speculative, some experts have postulated that the choice and execution of the Iranian’s strike suggests that it was designed to be minimally impactful while maximally theatrical. For one, knowledge of the attack was fairly well broadcasted several hours ahead of time and certainly not a well-kept secret. Perhaps more importantly, the choices made in the attack such as the number of projectiles and lack of hypersonic missile usage have suggested to some military analysts a reflection of more of a desire for spectacle than an intent for the attack to cause massive damage or casualties.
Meanwhile, the Israeli strikes have been described as limited as well, with the limit being the choice of target and method of engagement. The response was an unmanned drone airstrike on an Iranian airbase resulting in no reported casualties. There has been no evidence or indication that Israel took aim at any Iranian nuclear facilities.
In terms of their public statements regarding the Israeli drone strike, the regime has so far been publicly playing down the incident as an attack by “infiltrators”; some have interpreted this as out of the desire from the Iranian regime to not be forced into retaliating in an official state capacity further.
It could be that the Israeli response and subsequent Iranian walk-back from their more aggressive stance, are an attempt to reestablish the terms of engagement back towards the longstanding proxy war (Israeli military versus Iranian backed insurgents) away from escalation into a direct war between nations.
It’s critically important to understand that none of these variables are cemented or static, and claiming any of these takeaways or forecasts as being firmly predictable would be a mistake. However, an acknowledgement of motives and potential outcomes are imperative in understanding possible ramifications for markets.
When considering the state of the markets, one element to note is that the tensions in the Middle East are just one component influencing their price. But when assessing how much of an impact the most recent events have had, the answer appears to have been fairly modest.
While returns have been lower, the S&P 500 fell just ~-1.50% in the week following Iran’s drone and rocket attack; the index is now only down just over a percent since the strikes. Small caps fared slightly worse on the downside at ~-1.57%, but are now nearly off less than half a percent (-0.37%).
The damage given the new information from the events has been minimal to equity markets, which may be a surprise to some investors. Bonds, while volatile in their journey, are also near flat since the strikes (down -0.63%), after seeing an inflation spurred boost higher in bond yields and the Barclays Aggregate Bond Index falling -1% leading up to the attack in Israel.
In geopolitical fear inspired selloffs, one would expect to see high quality bonds rally as a flight to safety. Perhaps most surprising of all is oil, which fell lower on the week. Brent Crude just early in the month was as high as $91 but has slipped back into the high $80s ($89.25 today).
As mentioned before, markets appear to be approaching this situation with caution but not panic. Investors looking for a historical reference can find numerous examples of how markets have responded to geopolitical events.
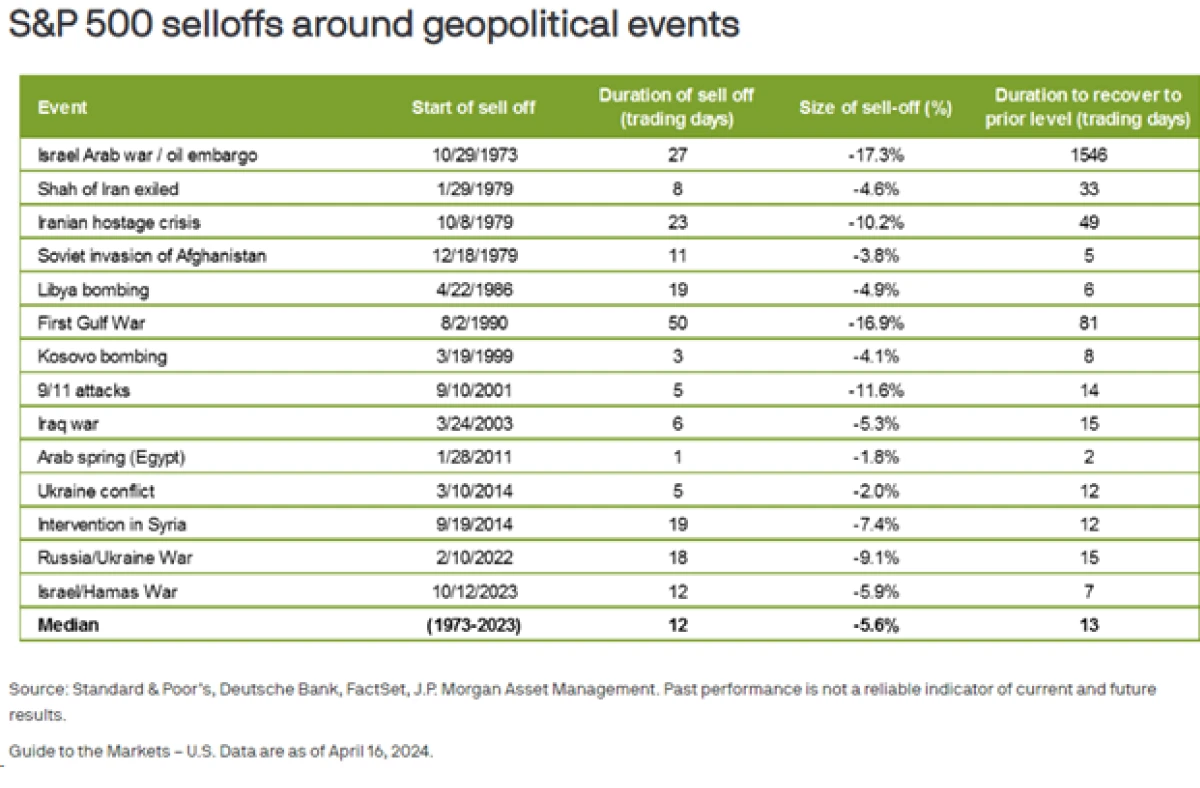
The disparity of market outcomes to these events have been wide ranging, but the majority have been fairly short-lived, with the median drawdown equating to -5.6% and the duration to recover 13 days. No single conflict is equivalent nor do they exist in a vacuum, but it is a reminder of the key investment tenet of refraining from overreaction in the fog of the moment.
Economic Drivers
Despite the recent volatility and the news cycle’s focus on geopolitical concerns, there are fundamentally driven reasons why one would remain optimistic towards the economy and the market. Today saw the advanced release of 1st quarter GDP for 2024. The number came in well below expectations at 1.6% versus the 2.5% average estimate; this could be considered an even greater surprise given forecasts from economists and the Atlanta Fed’s GDPNow model estimate had actually moved higher going into the report due to recent more positive economic growth indicators. Driving the miss was a corresponding miss in “personal consumption” (2.5% versus 3% estimate) which makes up the largest driver of GDP growth.
The second likely more concerning aspect of today’s reports to the markets was from the first quarter’s Core PCE Price Index (the Fed’s preferred metric for inflation and policy decision). Core PCE came in above expectations at 3.7% versus the 3.4% forecast, and represented a significant acceleration from the 2% prior quarter’s reading.
Tomorrow will see the release of the March PCE numbers, likely more relevant to the current inflationary status of the economy given its more recent timing.
While this inflationary data is elevated, it is important to note that one or even three hot PCE report does not represent a reversal in fortune. Inflation historically has rarely come down without pauses or even temporary reversals along the way.
Taking a deeper dive into the drivers of both reports shows some places for optimism that not all was as bad as it seemed. Largely producing the downside surprise in GDP was a widening trade deficit (in-line with a recent surge in the relative strength of the US dollar) and spending on inventories. When looking at more stable components of GDP, domestic consumption from services to goods continue to remain positive components for growth.
As for the inflation reading, the year-to-date rise in asset values and their corresponding costs was among the key reasons for the surprise higher in quarterly core PCE. The same data was shown from the latest CPI reports, but these costs have a higher weighting in PCE. Taken as a whole, the determining factor going forward will be if inflation stabilizes and returns to the downward trend established last year. The GDP story established from the recent report, upon examining the finer details, shows a consumer that is slowing but still above a level to drive above potential GDP growth if the more volatile components stabilize in the future. It does not indicate an economy heading into a recession.
We believe that a slowing but healthy level of consumption is evidence of the Fed’s tightening efforts having its intended effect, and ultimately could lead to a decline in pace of wage increases that trickles down to future inflation prints. This will ultimately likely require shelter costs, which has been the stickiest component of inflation, to slow.
The latest data on this front has seen some promise but is not yet conclusive. Housing starts and existing home sales came in below expectation for the month, while pending home sales and new home sales accelerated. This is evidence of higher mortgage rates weighing on homeowners’ appetite to sell while new construction continues to only partially fill the void; as the NAR continues to see median home prices rising 1.8% this year and next. There are pockets that have seen price declines regionally, markets such as in Austin and Boise saw rapid rises during the pandemic but have shown values according to Zillow that are down 4.1% from a year ago.
Federal Reserve and Inflation Expectations
As it pertains to its impact on markets, a resilient economy and sticky inflation means a recalibration of expectations for interest rate cuts. Fed Chair Jerome Powell had indicated optimism in March, stating that the Fed, while not elaborating on the timing, expected interest rate cuts this year.
The Fed’s “dot plot” showed an outlook for three cuts. Public messaging following the latest inflation data has shifted since, with some members raising the possibility of no cuts for the year. But what does that exactly mean for markets at this point?
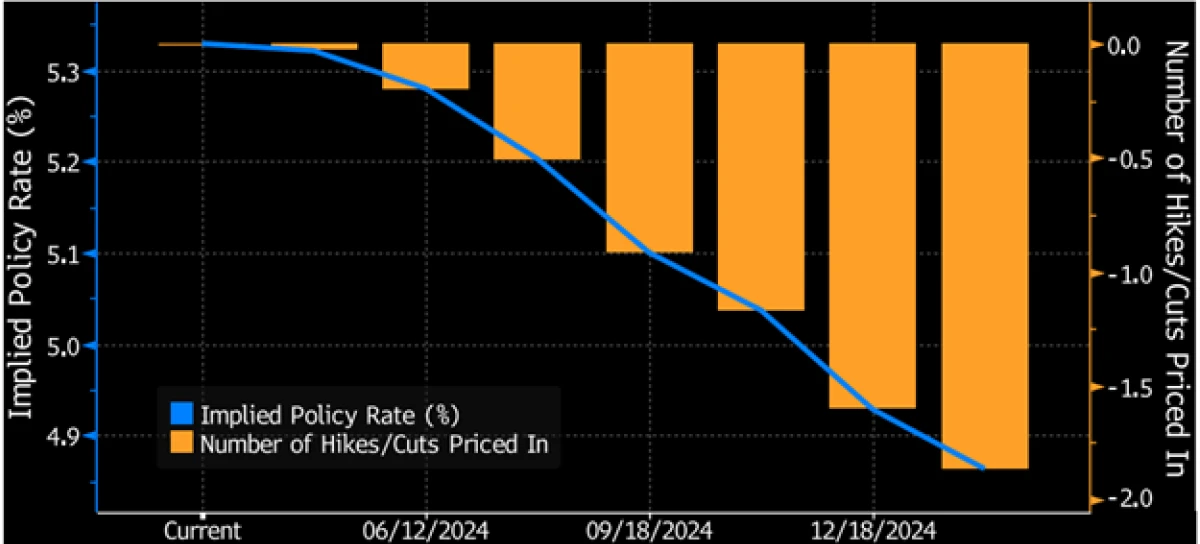
The market for interest rate futures is currently pricing in just under 1.5 rate cuts by the Fed’s final meeting in December, with the most probable first cut coming in either July or September. At the beginning of January, these same futures markets were pricing in 6 cuts by the end of 2024. Given what’s already being priced into markets, most of the readjustment to expectations appears to have already occurred, even if only one or even no cuts are implemented by the end of the year.
The biggest risk to interest rates at this point would be if other elements of inflation beyond shelter reaccelerate. This is a risk not out of the question, but not one we see as the most likely outcome.
Real inflation-adjusted wage growth has been lagging inflation which, while unfortunately placing pressure on consumers, could help mitigate the potential for increases in core inflation metrics. The hopeful result continues to be that stable supply chains and a reversion of shelter costs towards the remainder of core inflation should help continue inflation’s slow descent towards 2%.
As always, economists and analysts tend to look for historical parallels when assessing underlying trends in the economy. One such parallel, postulated by Garzarelli Capital, that has drawn notice has been the CPI metrics when assessing the inflationary environment between WWII and the present.
From a visual perspective, the charts do have some clear similarities. Inflation rapidly rose (over 1-year for the post WWII period and 2-years for present period), had a subsequent quick decline, and then a steep decline (over 8 months for the post WWII period and 1 year for present period), inflation then “paused” (9 months for the post WWII period, we are in month 10). Following the pause for the WWII period, inflation resumed a steady decline into a rate that became deflationary.
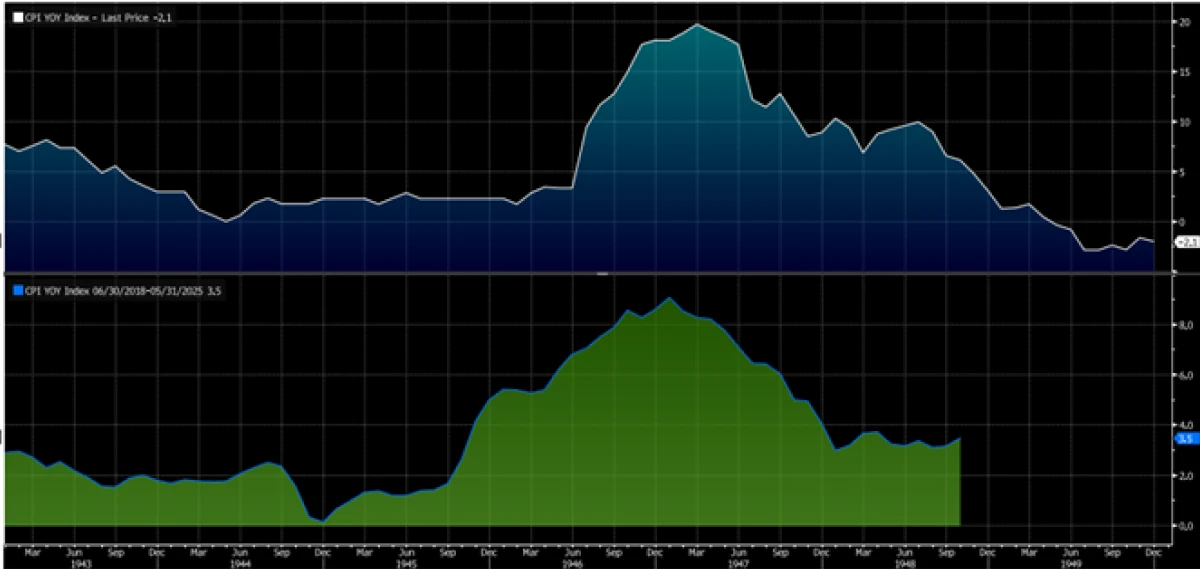
There are some fundamental economic parallels one could draw as well. The post-WWII U.S. economy and its inflationary period was largely defined by supply shortages and pent-up demand. While not a post-war economy, the post-COVID economy also saw an unleashing in demand following a lifting of lockdowns and a stimulus payment motivated consumer combined with pandemic related supply chain issues.
If the present plays out like the historical example, a hope would be that the brief recession suffered in 1948 can be avoided outright, and that a second wave of inflation can be avoided in the future. A decline in inflation would be a relief to markets with likely a rally in bond yields leading up to expected loosening of Federal Reserve monetary policy.
Conclusion
We will continue to keep a watchful eye on the continued developments impacting markets. The situation is dynamic with new developments guaranteed in the coming days and weeks ahead. The upcoming guidance from corporations as Q1 earnings continue releasing will be an important story to follow.
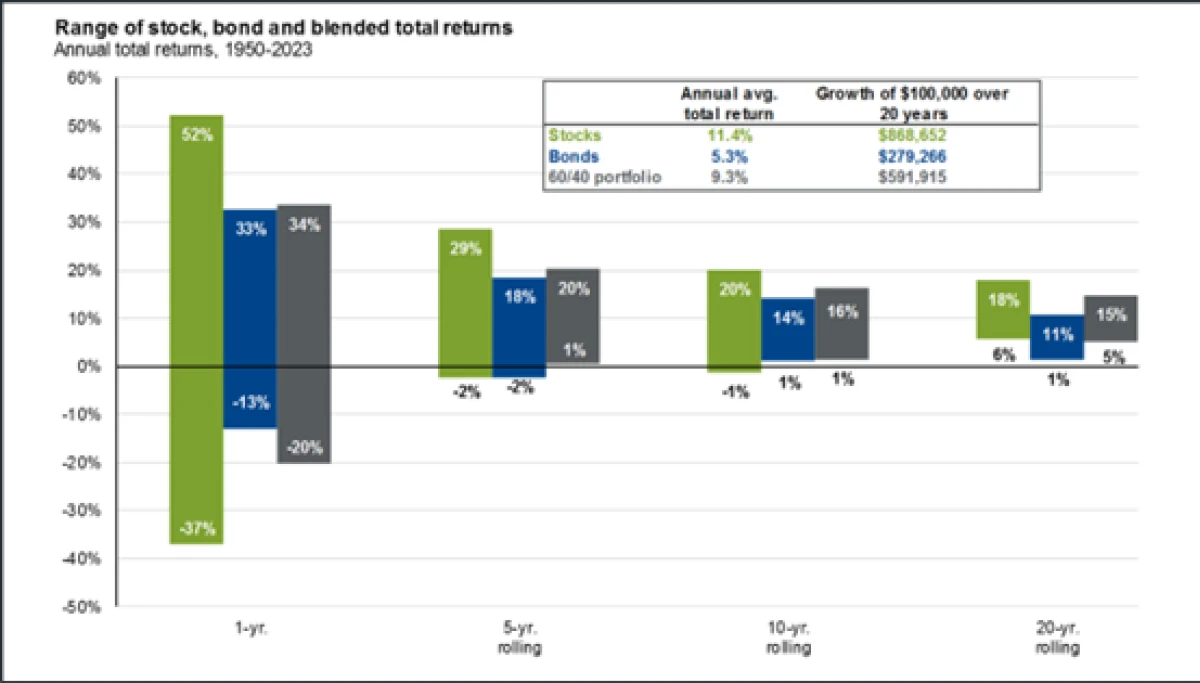
For fixed income, the move higher in yields over the past two years has resulted in bonds paying higher coupon payments, thus providing a greater income “cushion” component that should help these securities more going forward and offer protection to balanced portfolios. Maintaining one’s investment through a full market cycle can at times be mentally and even emotionally taxing, but it has had strong success over the long-run.
Source: Bloomberg, FactSet, Federal Reserve, Robert Shiller, Standard and Poor’s, Strategas/Ibbotson, J.P. Morgan Asset Management
Need Some Help?
If you’d like some help from one of our CPAs or CERTIFIED FINANCIAL PLANNER (CFP®) advisors regarding this strategy and how it applies to you, the Rhame & Gorrell Wealth Management team is here to help.
Our experienced Wealth Managers facilitate our entire suite of services including financial planning, investment management, tax optimization, estate planning, and more to our valued clients.
Feel free to contact us at (832) 789-1100, [email protected], or click the button below to schedule your complimentary consultation today.
IMPORTANT DISCLOSURES:
Corporate benefits may change at any point in time. Be sure to consult with human resources and review Summary Plan Description(s) before implementing any strategy discussed herein.Rhame & Gorrell Wealth Management, LLC (“RGWM”) is an SEC registered investment adviser with its principal place of business in the State of Texas. Registration as an investment adviser is not an endorsement by securities regulators and does not imply that RGWM has attained a certain level of skill, training, or ability. This material has been prepared for informational purposes only, and is not intended to provide, and should not be relied on for, tax, legal or accounting advice. You should consult your own CPA or tax professional before engaging in any transaction. The effectiveness of any of the strategies described will depend on your individual situation and should not be construed as personalized investment advice. Past performance may not be indicative of future results and does not guarantee future positive returns.
For additional information about RGWM, including fees and services, send for our Firm Disclosure Brochures as set forth on Form ADV Part 2A and Part 3 by contacting the Firm directly. You can also access our Firm Brochures at www.adviserinfo.sec.gov. Please read the disclosure brochures carefully before you invest or send money.


