Market Update – August 2024
An Overview of the Markets, Economic Data, and The Road Ahead
After what has been a relatively calm year in financial markets so far, August has begun with a resurgence in volatility. Following a July in which markets powered higher despite a dramatic news cycle ranging from a Federal Reserve meeting to an assassination attempt on a Presidential candidate, August has seen the S&P 500 pullback over 6% in the span of a week.
In times such as these, investor anxiety can be understandably heightened, but it also becomes even more important to set emotion aside and take an objective perspective in both assessing the various factors driving volatility and putting it all into the context of what should be expected going forward.
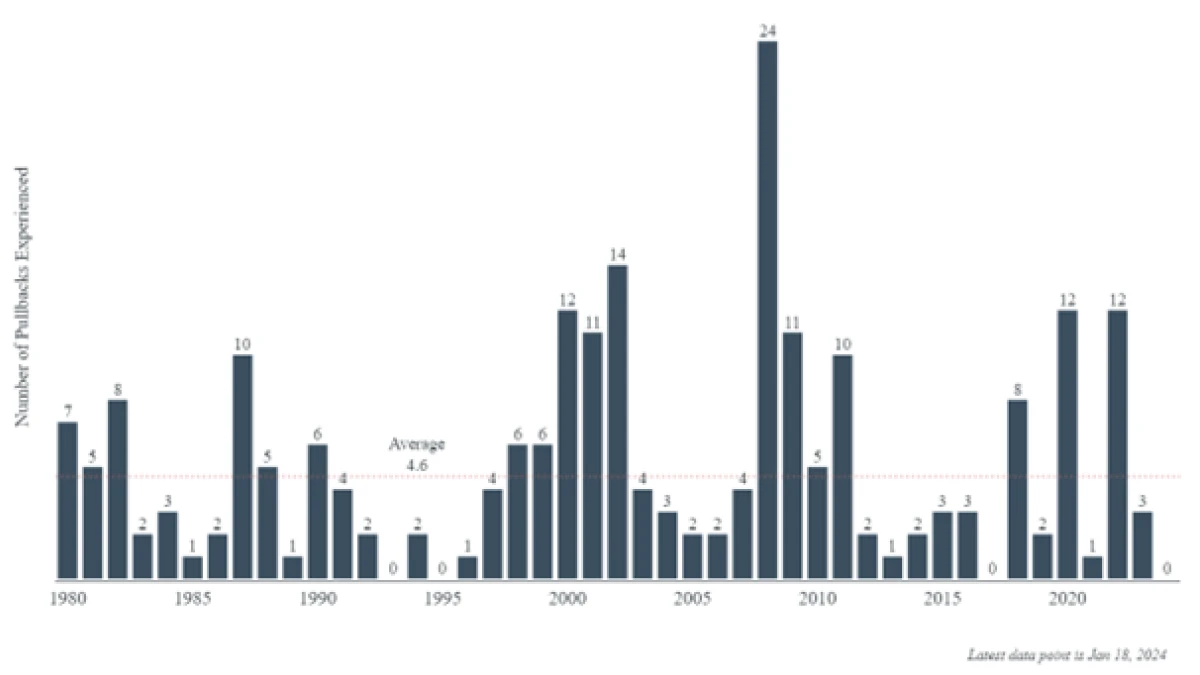
As of this morning, the S&P 500 is down just over 8% from its all-time high set less than a month ago in mid-July. Since 1980, the S&P 500 has had on average 4.6 pullbacks of 5% or more a year.
Sources: Clearnomic, Standard & Poor’s
Market Volatility
A decline of 10% or more (known as a correction) has happened essentially every year on average in that same timeframe. These drawdowns from highs in the market are never pleasant experiences for investors, but they have always been temporary and often resolve themselves in a relatively quick manner.
The U.S. large cap stock market is still over 8% higher for the year, and has been in a “bull market” (a stock market characterized by a trend of rising stock prices and investor optimism) since October 2022. Since 1877, the U.S. has had 26 total bull markets (Source: Fidelity) which together lasted a median of 42 months (3.5 years). Market corrections have on average lasted 4 months with the average drawdown being 14% (Source: American Century).
While it is possible that this pullback in the market could become something more severe than a correction, history tells us that this bull market likely has more room to run and that a recovery from current levels to all-time highs before the end of the year is more likely. While the NASDAQ 100 (down 12.27% from its high) is in a correction, the S&P 500 has not yet even fallen to the point of correction.
A number of factors could be pointed to as contributing to the recent rise in stock market volatility. The most highly profiled of these factors are concerns over the Federal Reserve’s interest rate policy as well as a slight uptick in unemployment on the most recent labor market data.
These two events last week sparked fears over the health of the U.S. economy. There are certainly other narratives driving concern (including conflict in the Middle East, the U.S. presidential election, and more), but economic and financial fundamentals are typically more influential on market performance over the long-term than geopolitical tensions and domestic politics.
Economic Data
The most fundamentally significant of the two factors we’ve pointed to is the recent data reported regarding the U.S. labor market. Last Friday’s reports included changes in nonfarm payrolls, average hourly earnings, and the unemployment rate for the end of July. Each of these figures came in worse than economists’ expectations. Change in nonfarm payrolls was reported as 114k versus 175k expected, and the previous month’s (June) numbers were revised downward from 206k to 179k.
The “keystone” report, U.S. unemployment rate, ticked higher to 4.3% which was above the expected 4.1% (the same rate in June). It’s important to note that the 4.3% number is still a historically low unemployment rate; 4.3% was seen in 2017 in an economy that was by most accounts considered a solid and healthy economy.
The trend is what is raising concerns here, as the unemployment rate has moved both higher in value and relative to expectations in each monthly report since March.
Under the surface though, there are several signs showing that the labor market may continue to be stronger than the market’s reaction may suggest.
Much of the surprise increase in unemployment was a result of “temporary layoffs” as well as “reentrants” coming in higher than expected.
Reentrants are characterized as individuals who previously left the labor force but have now returned to find work, while temporary layoffs are those individuals who were given a date to return to work or are expected to return to work within 6 months. Layoffs themselves continue to be at a record low as employers have continued to retain their workers – investor focus for now appears to be on those who do not have a job but are looking for one.
There is also some speculation that the latest labor reports have been skewed by a non-recurring external factor: Hurricane Beryl. While the Bureau of Labor Statistics (BLS) noted in their report that Hurricane Beryl did not impact the July jobs data, more than a few analysts and pundits have questioned this statement (source: Reuters).
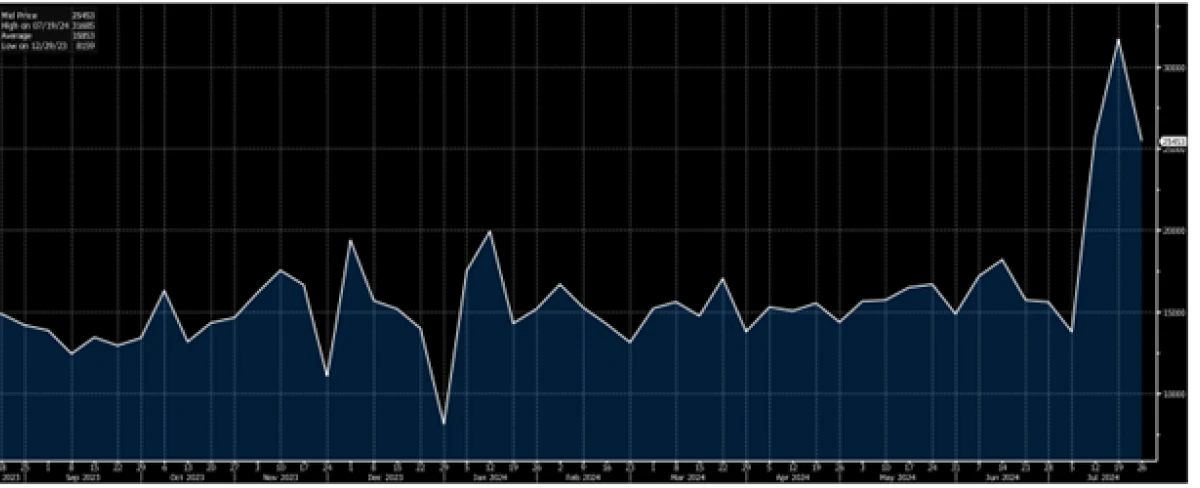
436,000 nonfarm workers reported not being able to work due to bad weather. During an ordinary week in Texas, ~15,000 people file for unemployment insurance (United States Department of Labor via macro specialist Jim Bianco of Biancoreasearch.com). As seen below, for the week of July 12th and July 19th, 25,000 and 31,000 filed claims respectively.

US DOL State Unemployment Jobless Initial Insurance Claims (Texas)
Source: Bloomberg
There’s also a strong likelihood that this ~26,000 in excess unemployment claims for the state did not represent every individual who could not work, as it is likely not everyone could file a claim. Ultimately, our belief is that while the labor market is weakening from a level of historical strength, to state that a recession is underway or on the way would be an overstatement at this point in time.
From the consumer’s perspective, July showed positive surprises in the form of retail sales being unchanged. Additionally, the advanced estimate for GDP in the second quarter was reported as 2.8%, much higher than expectations of 2%. While the labor data is worth modest concern, inflation is now well on the way to the point of the Fed becoming more focused on the labor market/inflation balance than it is on bringing down price acceleration alone.
A loosening of monetary policy in September could provide employers the needed confidence to cap the current upward unemployment trend and bring the labor market to a normalized equilibrium. At minimum, more layoffs and a sustained increase in protracted job searches is needed before a reasonable prediction that a recessionary environment is on the horizon could be made.
The Fed
At their core, economic fears in the U.S. are based on the concern that the Federal Reserve may have made a “policy mistake”. The Federal Reserve announced last Wednesday on the last day of July that they were leaving the current federal funds rate unchanged when some thought a .25% cut could be appropriate.
However, the Fed’s written statement saw a notable change in language with a switch from the Committee being “attentive to inflation risks” to instead stating “attentive to risks to both sides of its dual mandate.” Chairman Jerome Powell also said at this press conference that if the inflation data continued along its current path that a cut in September would be on the table.
The Fed’s rate decision occurred prior to the poor labor market data released two days later. With the addition of the new labor market data point, many are now wondering whether the Fed would have cut rates had they known this data and if they are now by extension behind the curve in the rate cutting cycle.
The bond market has rapidly priced in additional rate cuts in the aftermath of both the announcement and latest data.
This combined with the interest rate futures market points to a market that seemingly believes a policy mistake (albeit an easily fixed one) has been made. The market for interest rate futures is essentially pricing in a total of 4.5 cuts (1.125%) to the Federal Funds rate by the end of the year, with a “double cut” of 0.5% essentially fully priced in for the Fed’s next meeting in September.
In our view, the latest news from the labor market data isn’t necessarily a justified catalyst for the Fed to begin cutting. What does justify lower rates, however, is the progress that has been made on inflation.
The Fed’s preferred measure of inflation, Core PCE index is signaling that inflation is trending towards their targeted level of 2%. If one were to take the last three months reports (0.2%, 0.1%, 0.2%) and project their average over a year, the number would be very close to 2%.
With inflation trending at these levels and the job market having shown signs of softening, the Fed does seem set to begin the cutting cycle. The question many are now asking is how fast and how much the Fed will cut rates, and if the market will ultimately be satisfied with this outcome.
With the Fed’s next meeting not being until September 18th, how the officials discuss economic developments going forward into the next announcement will be extremely important regardless of if the next decision is a 0.25% or 0.50% cut. A central bank that is cutting for the right reasons (to maintain economic and market stability) backed by supporting data is the type of monetary policy backdrop that would be supportive to a rebound in the markets.
As we highlight throughout this update, while there has been a substantial amount of negativity in the headlines driving markets over the past two weeks, the fundamentals that have been supportive of market growth this year have not yet been definitively dislodged.
With over 75% of the S&P 500 having reported earnings for Q2, the index appears to be set for another quarter of strong earnings growth above analyst expectations. Through today’s results, stocks have seen earnings grow in aggregate by over 11.2% with an aggregated upward surprise of nearly 5.2%.
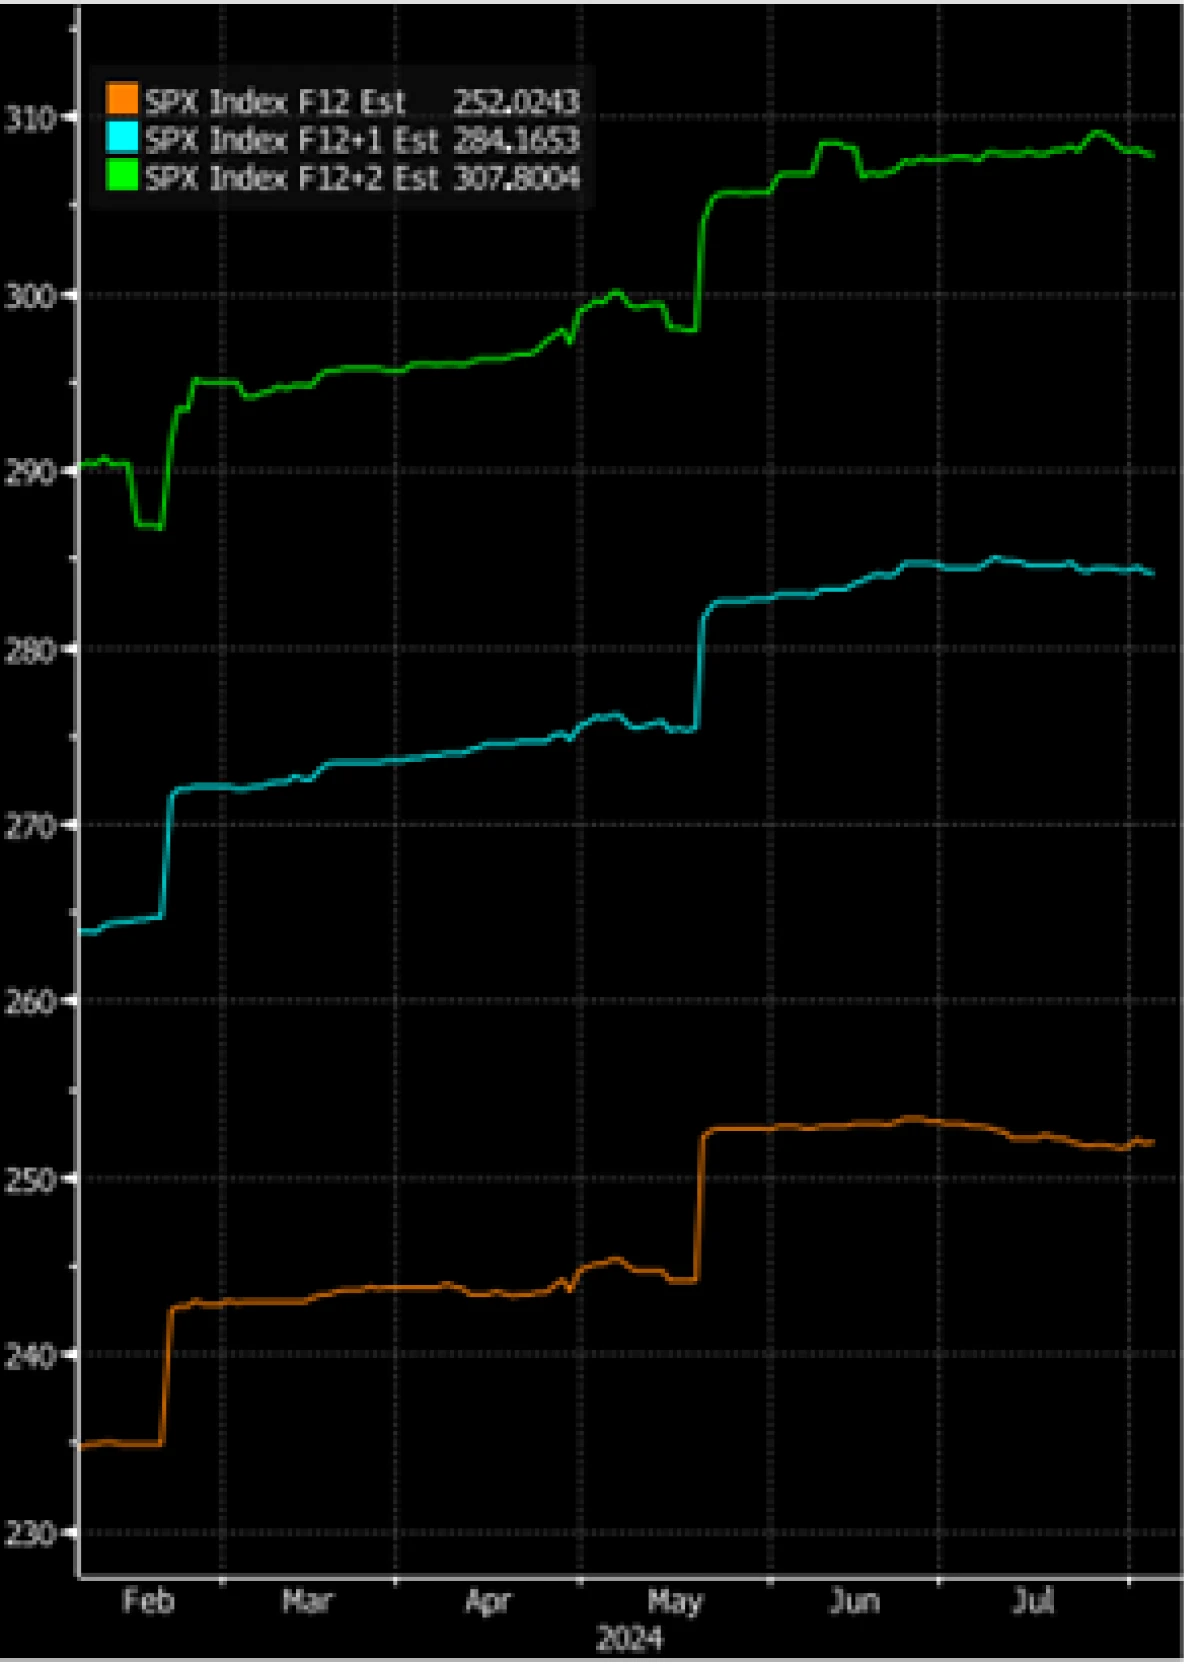
Sales growth has been more modest at 4.95% (~1% surprise to upside), but these results are not indicative of substantial economic weakness. Looking forward towards 2025 and beyond, earnings expectations for the index have remained fairly stable since the start of earnings season and have in fact risen higher since the beginning of the year.

S&P 500 Forward EPS Estimates
Source: Bloomberg
If the cracks in the labor market increase and fears of an economic slowdown are legitimate, then a concurrent revision downward in earnings expectations will follow. Lower expectations for earnings over the next year would lend credence to a temporary decline in the stock market and we will be keeping a watchful eye on the guidance that will continue to be provided by the corporate world.
As more data is released over the month, we will gain more insight into the current state of the U.S. economy and how the Federal Reserve plans to proceed and how the corporate world is responding to the changing environment.
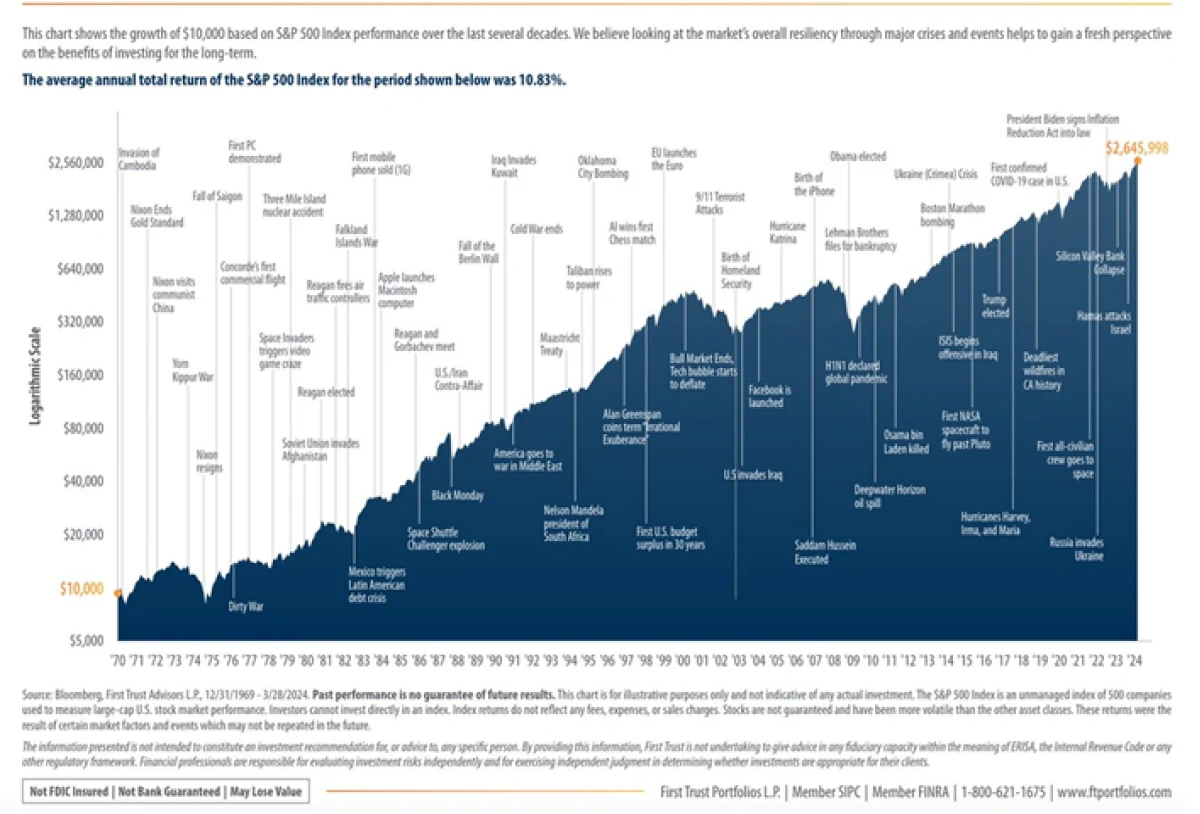
A multitude of other factors, ranging from the U.S. Presidential election and the conflict in the Middle East, will continue to hold a high profile in investor conversations, but we believe the fundamental factors we have described are the most likely to drive the markets forward over the long-term. The adaptability and resiliency of the corporate world to produce profits and drive shareholder value has always proven more impactful and lasting than the many crises experienced through history.

S&P Value Across Historical Crisis and Events (Since 1970)
Source: Bloomberg, First Trust
Need Some Help?
If you’d like some help from one of our CPAs or CERTIFIED FINANCIAL PLANNER (CFP®) advisors regarding this strategy and how it applies to you, the Rhame & Gorrell Wealth Management team is here to help.
Our experienced Wealth Managers facilitate our entire suite of services including financial planning, investment management, tax optimization, estate planning, and more to our valued clients.
Feel free to contact us at (832) 789-1100, [email protected], or click the button below to schedule your complimentary consultation today.
IMPORTANT DISCLOSURES:
Corporate benefits may change at any point in time. Be sure to consult with human resources and review Summary Plan Description(s) before implementing any strategy discussed herein.Rhame & Gorrell Wealth Management, LLC (“RGWM”) is an SEC registered investment adviser with its principal place of business in the State of Texas. Registration as an investment adviser is not an endorsement by securities regulators and does not imply that RGWM has attained a certain level of skill, training, or ability. This material has been prepared for informational purposes only, and is not intended to provide, and should not be relied on for, tax, legal or accounting advice. You should consult your own CPA or tax professional before engaging in any transaction. The effectiveness of any of the strategies described will depend on your individual situation and should not be construed as personalized investment advice. Past performance may not be indicative of future results and does not guarantee future positive returns.
For additional information about RGWM, including fees and services, send for our Firm Disclosure Brochures as set forth on Form ADV Part 2A and Part 3 by contacting the Firm directly. You can also access our Firm Brochures at www.adviserinfo.sec.gov. Please read the disclosure brochures carefully before you invest or send money.


