Market Update – February 2024
An Update On The Markets, Economic Conditions, Monetary Policy, and Geopolitical Factors
Market Performance
The first two days of February has seen a post-federal reserve announcement motivated (modest) selloff, followed by a day-after sharp recovery. The result has been the market once again reaching new all-time highs.
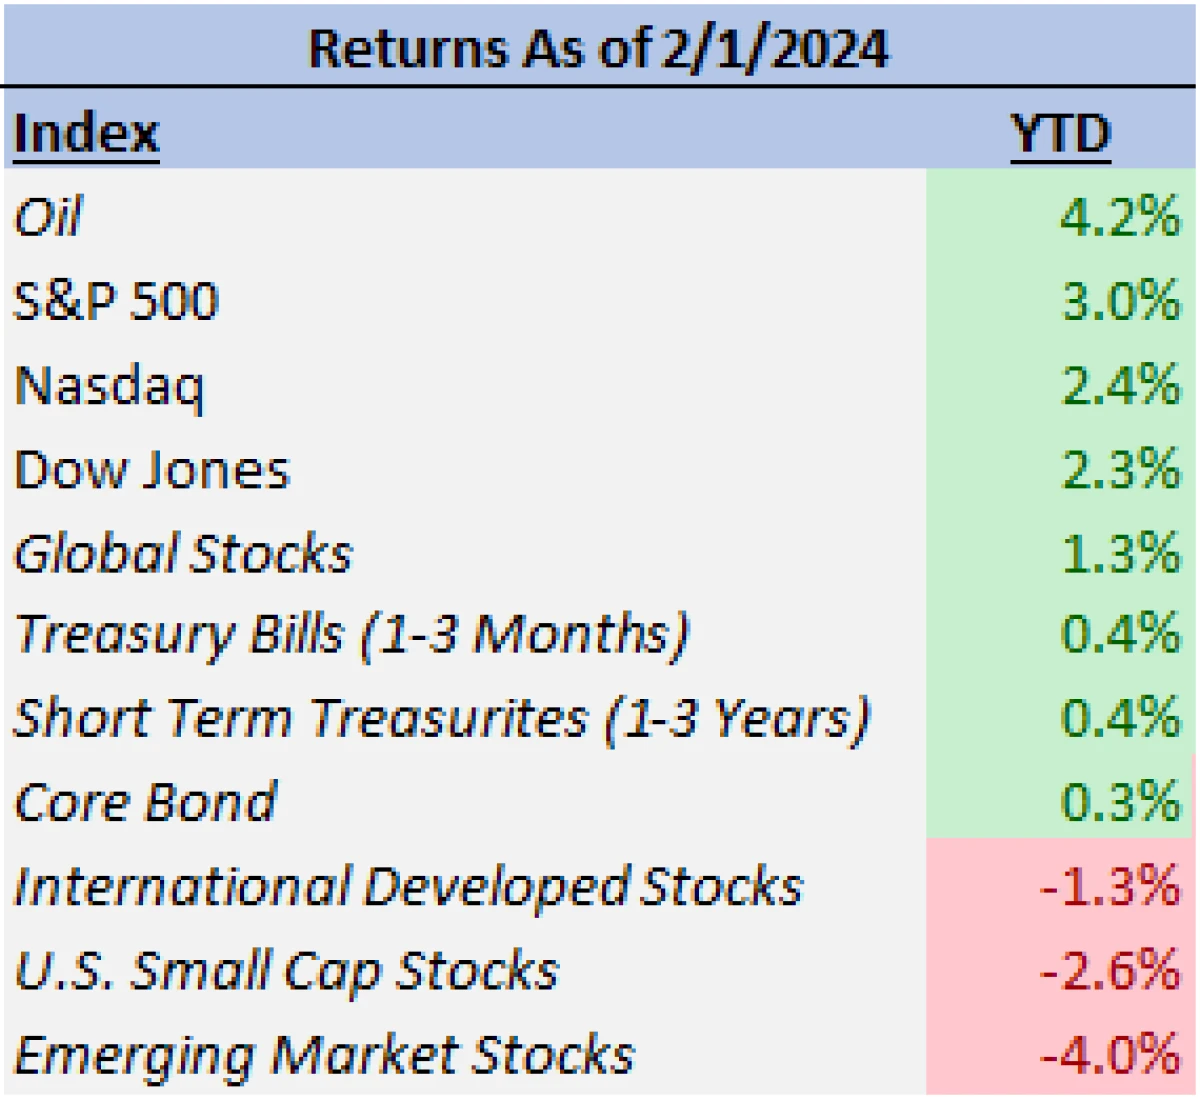
The S&P 500 ended January returning 1.7% for the month and stands at 3% year-to-date. Since a turbulent second half of last October, the index has seen a remarkable rally, with a return-to-date since the October 27th bottom of over nearly 20%.
On a sector basis, most of the biggest contributors to the high returns of the last half of 2023’s fourth quarter have continued to lead the market higher to start 2024. Communications services, technology, and healthcare have led the S&P 500 year-to-date, having returned 11%, 6.9%, and 4.5% respectively.
However, participation in the rally year-to-date has been notably narrower when compared to the broad-based increase experienced in 2023’s final months. Real estate and materials stocks, for example, each had double digit gains from the rally’s beginning to 2023’s end, but these sectors have since seen some weakness with negative returns year-to-date (-4% and -2.6% respectively).
Large cap growth stocks (Russell 1000 Growth) have continued to outperform their large cap value (Russell 1000 Value) peers year-to-date (4% and 1.1% respectively) after showing the same relative trend at the tail end of last year (17.9% versus 15.7%).
Small cap stocks (per the Russell 2000) outperformed their large cap counterparts over the late 2023 rally period, returning over 24% after the October bottom. The small cap stock index has trailed year-to-date with modestly negative returns (-2.6%).
International and emerging market stocks have also continued to underperform the U.S. as a group, having returned -1.3% and -4% year-to-date. After trending lower in correspondence with rising yields, U.S. bonds rallied to end the month nearly flat year-to-date (0.3%). In lockstep with the rally across asset classes from late October to January’s end, U.S. bonds have gained over 8.5%.

Economic Growth
Fueling the rally we’ve seen since the latter two thirds of 2023’s fourth quarter has been a strengthening of the market’s belief that a soft landing is not only possible but becoming more likely. The path to such a soft landing is a combination of resilient economic growth, normalizing inflation, looser financial conditions, and a moderating but still healthy labor market.
Last Thursday’s advanced Q4 2023 GDP release delivered a substantial positive surprise when compared to surveys. The first release of the growth figure showed year-over-year growth of 3.3% versus the consensus forecast of 2%. In a year where many were predicting a recession, the U.S. actually experienced above trend growth in 2023 of 2.5%.
While the consensus forecasted probability of recession for 2024 has decreased in the last month, it still remains an elevated estimate at 45%. Consensus expectations for 2024 GDP stands at just 1.5%, with 2.3% as the forecast for the first quarter.
The Federal Reserve Bank of Atlanta releases its own model forecast (the GDPNow model); this model based off available economic data for the current measured quarter is estimating that Q1 is tracking at a rate of 4.2%. With just a month of economic data to work with at this point, the forecast will certainly change over the next two months. But according to this model’s criteria, the economy is on track to beat expectations once again.
Several other more forward looking economic growth focused data releases have also shown positive surprises and developments. Both the S&P Global US Manufacturing and Services PMI’s beat survey expectations showing modest growth in both with numbers of 50.3 and 52.9 respectively versus the forecasts of 47.6 and 51.5. Values greater than 50 indicate expansion while those less than 50 are contractionary.
Consumer sentiment appears to be improving as well. The University of Michigan’s consumer sentiment survey reported a value of 78.8 which beat the expected value of 70.1. The number was the highest reported since July 2021.
Inflation and Labor
The inflation and labor market dynamic continues to be among the most important variables to watch. Both, along with economic growth, will heavily weigh in the Federal Reserve’s decision-making framework.
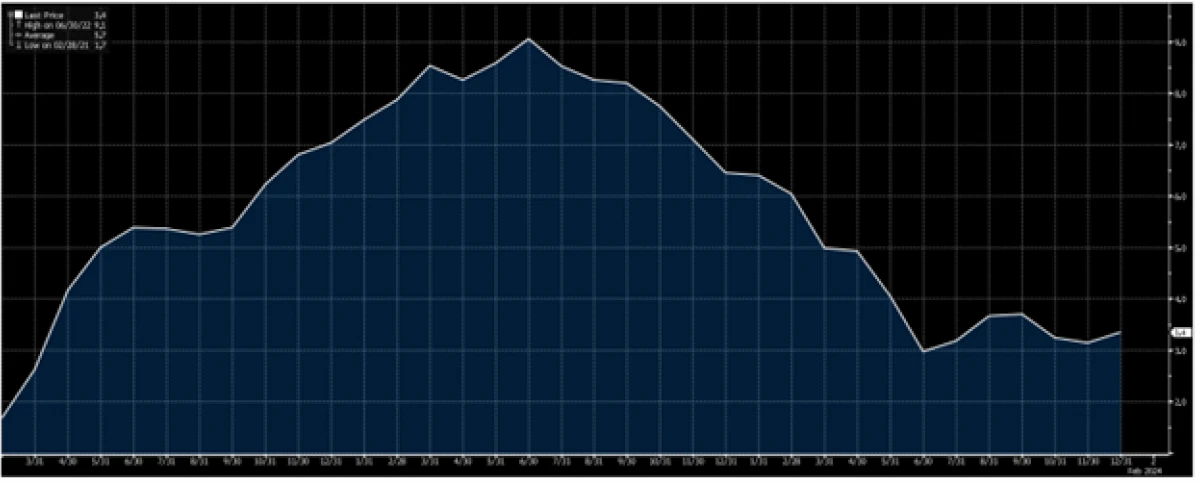
The results from the latest round of inflation-related data were mixed. CPI on a year-over-year basis for December showed that prices rose 3.4%, slightly higher than the consensus forecast of 3.2% and higher than November’s 3.1%. It was the highest inflation reading since September but still significantly lower than the 4%+ reported figures from the Spring of 2023.
CPI ex Food and Energy also came in above consensus expectations at 3.9% versus the forecasted 3.8% year-over-year. The report, however, was another deceleration from November’s core inflation reading and a continued trend in the right direction.
Impacting the overall higher than expected CPI data for December was a milder decline in the energy portion of the index than expected; energy acted as an increasing contributor to inflation on a seasonally adjusted basis.
Somewhat counteracting the slightly disappointing CPI results were the encouraging results from the Producer Price Index (PPI) reports. Both overall PPI and core PPI (ex-Food and Energy) for December came in softer than economists expected. Overall PPI Final Demand on a month-over-month basis actually declined slightly at -0.1%, representing monthly deflation in producer prices.
Wrapping up the month’s inflation data, the Fed’s preferred measure of inflation, the PCE Deflator, reported in line with expectations at 2.6% year-over-year and 0.2% month-over-month. The core PCE metric came in slightly milder than expected at 2.9% versus the survey forecast of 3%.
Through December and from the early data from January, the labor market has continued to show strength. JOLTS Job Openings unexpectedly increased, showing 9,026K openings compared to 8,925K reported in the December period; the expectation was a decline to 8,750K. Changes in nonfarm payrolls have also surprised to the upside for three straight months, with increases of 199k (November), 216k (December), and 353k (January).
The latest January report nearly doubled the consensus economist forecast of 196k. Finally, the unemployment rate remained at 3.7% for the third straight month as well, compared to the predicted mild increase of 3.8%.

US CPI Year-Over-Year
The Fed
With an economy more than adequately growing, inflation continuing to moderate, and a still strong labor market, the Federal Reserve seemingly has the luxury of taking a “wait and see” approach to its monetary policy. If one believes Chairman Jerome Powell’s comments at the latest January post decision presser, then that appears to be exactly what they intend to do.
Some key language used by Powell included an emphasis on needing to see “continued declines in inflation” to demonstrate that it is “on a sustainable path down toward 2%”. He also stated that they are “not rushing” and perhaps to the market’s immediate post-presser concern he stated that a rate cut at the March meeting (a prospect that markets initially saw as more than probable) was not in the cards and “not the most likely” base case.
The general belief from market participants continues to be that multiple rate cuts are likely to occur in the second half of this year. This belief in the future trajectory of rates is one that we share.
While Powell maintained a patient approach to the Fed’s monetary policy outlook, the path towards the data achieving their implied threshold to cut in the future seemingly remains intact. Powell stated that the “policy rate is likely at its peak for this tightening cycle” and that if the economy, and most importantly inflation, develops as expected “it will likely be appropriate to begin dialing back policy restraint at some point this year”.
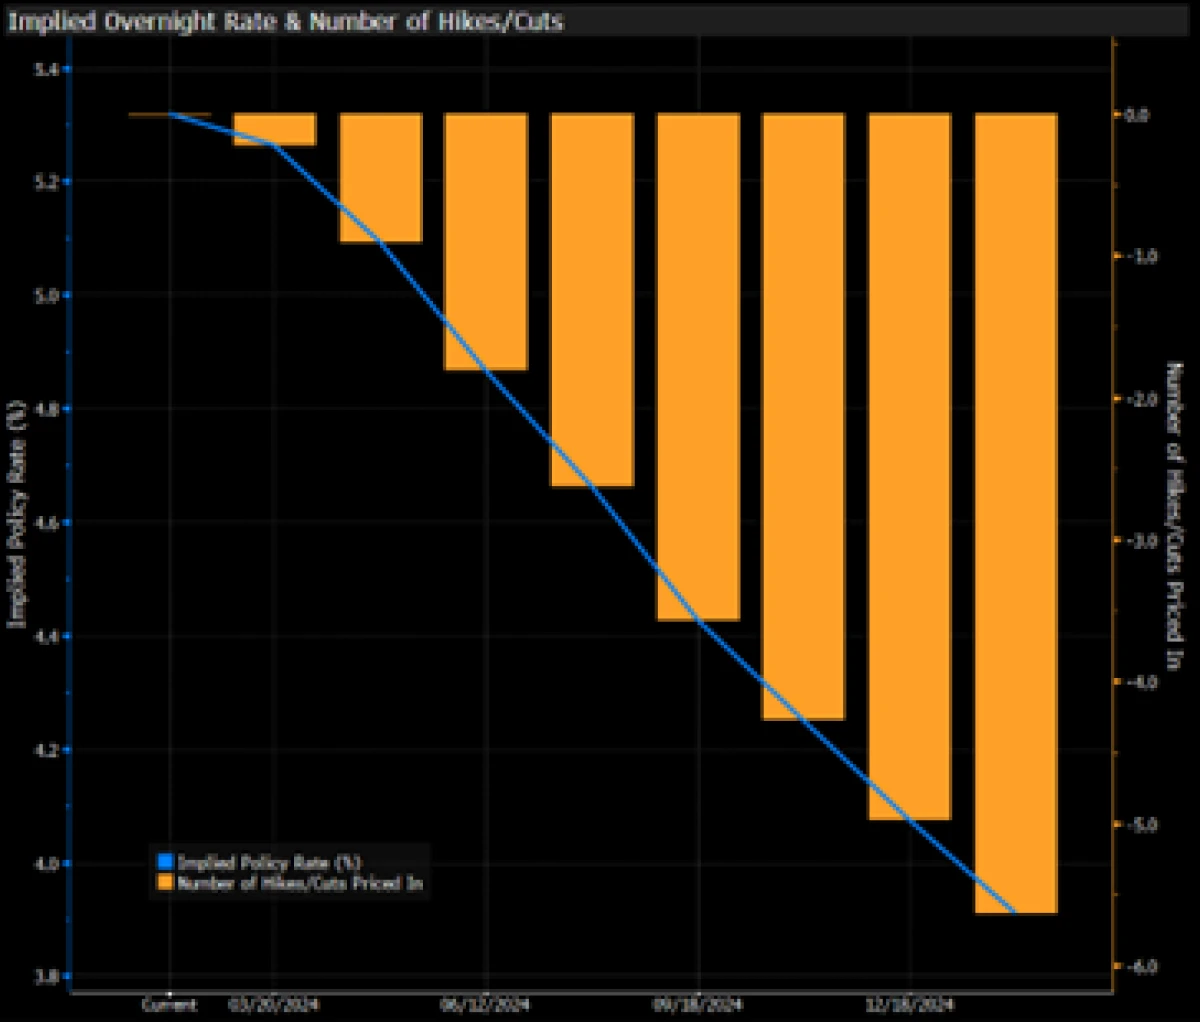
Fed Funds futures markets currently imply nearly a 97% probability of a cut occurring at the May meeting. If a cut in May does occur, we will likely hear the groundwork set for such a move during the Fed’s next meeting in March.
If there is a concern to be had here, it is squaring the market’s current high expectations for the pace of cuts with the more patient approach being broadcast by the Fed. The same Fed Funds futures markets show that investors are pricing in nearly 5 rate cuts by the end of 2024. How the market absorbs any disruptions to these expectations is among the most notable risks to near-term equity and fixed income performance.

Implied Federal Funds Policy Rate & Number of Hikes/Cuts
Earnings
We are deep into earnings season with nearly half of the companies in the S&P 500 having now reported their 4th quarter results of 2023. The results so far have been mostly encouraging, with the collective average of the 218 companies scoring 1.26% aggregate surprise on sales and a 7.16% surprise on earnings. Overall sales and earnings growth has also remained positive at 4.47% and 7.03% respectively.
Notable winners relative to expectations on the sector level include energy, consumer discretionary, and health care. Energy and health care companies sustained significant declines in earnings growth (falling -33.28% and -25.93% respectively) but both managed to surpass expectations with positive surprises of 21.55% and 11.88% each. Of the 18 companies having reported in the sector, consumer discretionary companies have managed to surprise to the upside in earnings by 13.33% while also achieving year-over-year earnings growth for the quarter of nearly 50%.
Within the consumer discretionary sector, the most high-profile individual winner was Amazon (AMZN). The e-commerce giant reported a revenue jump of 14% ($170 billion for the quarter) following a “record-breaking” holiday shopping season and increased sales at AWS.
The high revenue number beat the street’s expectations of ~$166 billion and earnings of $1.00 per share beat the $0.80 EPS forecasted by analysts. The EPS reported was a near 300% increase over 2022’s year’s fourth quarter result of $0.253 per share.
One could view Amazon’s success over the holiday season as a continued sign of consumers’ continued financial strength and willingness to spend. A positive data point given consumptions heavy impact on the country’s GDP.
While only 4 of 30 companies have reported so far, the most notable losing sector has been in Utilities where sales have surprised to the downside by nearly 6.5%.

Q4 2023 S&P 500 Sales and Earnings Surprises by Sector

Q4 2023 S&P 500 Sales and Earnings Growth by Sector
Geopolitics
While economic and financial conditions have remained encouraging, the geopolitical landscape continues to be disconcerting. War and a humanitarian crisis is ongoing in Gaza, and most recently a drone attack that tragically killed three U.S. military service members in Jordan. U.S. officials have confirmed the drone attack as tied to Iranian-backed militants and have confirmed plans for retaliatory strikes on Iranian personnel and facilities in Iraq and Syria.
These developments represent the most escalatory actions yet in the Middle Eastern conflict. A large-scale military incursion by the U.S., while higher than it’s ever been, remains unlikely in our view given the devastating human and (certainly less important) fiscal toll such a likely long-lasting conflict would bring; but the prospect of continued violent activity in the region is likely inevitable and with these conditions are the potential for inflationary impacts from supply chain disruptions and energy price volatility.
War also continues to be waged in Europe, as the Russian invasion and Ukrainian resistance remains ongoing. The same potential for a growth in the conflict in that region, while not our base case, cannot be ignored as a possibility. Energy and supply chain related inflationary impacts remain potential ramifications there as well.
Attention must also be given to China and their strategic goals with Taiwan. While we do not see a broader conflict in that region in the near-term, tensions remain high. Geopolitical risk across the world is certainly elevated, and maintaining a proper risk tolerance focused exposure in one’s investment portfolio is of key importance in navigating through all stages of market activity; those stages ranging from times of market growth and market volatility. These stages of market volatility can be motivated by both economic and geopolitical factors.
Conclusion
When it comes to the state of the U.S. economy, rising investor optimism, reflected in the consumer sentiment surveys and recent rally in stock prices, appears to be warranted. While the exact timing of the Fed’s shift to a rate cutting cycle is still unknown, both the central bank’s acknowledgement that rates have likely hit their peak and the easing of inflationary pressures points to a pivot towards a more dovish approach from the Fed happening on the horizon.
If the pace of economic growth and labor market conditions soften but retain resiliency, the once thought of as elusive soft landing is achievable. Of course, the path forward is not without its risks.
External shocks and factors such as geopolitical events are always a possibility, and the risks for these escalating tensions are higher now than in the recent past. The current evidence points towards financial conditions set on a path towards easing, but the risks of a return of energy and supply chain related pricing pressures returning are not negligible.
Combine this risk with the upcoming Presidential election season nearing its general campaign stretch and the possibility of intermittent volatility occurring through the year is likely. However, as discussed in these newsletters on more than occasion, volatility in any given year is normal. It is simply a prerequisite part of the path towards long-term success as an investor in the market.
Market corrections are common; over 20 corrections have occurred in the last 50 years with the average drop being nearly 15%. In the month following the bottom of these markets correction, the S&P 500 rose an average of more than 8%, and more than 24% one year later.
Having the appropriate balance of a diversified pool of assets that match one’s risk tolerance, time horizon, and financial plan goals, has always been our approach in maximizing our clients’ probability of success in achieving an optimal financial outcome.

Graphic from Lord Abbett “Riding Out Market Ups and Downs”
With all this in mind, some degree of volatility (just like in any market environment) is a distinct and likely possibility; but we do believe the economic backdrop, along with corporate earnings execution, has placed the market in a position for stocks and bonds to continue performing well as we move through the year.
When volatility does rear its head, we believe our long-term and individual risk focused portfolio positioning will allow clients to navigate through those times to longer term positive outcomes. We will continue to watch the market and economic environment diligently and communicate any changes to our strategic outlook.
Need Some Help?
If you’d like some help from one of our CPAs or CERTIFIED FINANCIAL PLANNER (CFP®) advisors regarding this strategy and how it applies to you, the Rhame & Gorrell Wealth Management team is here to help.
Our experienced Wealth Managers facilitate our entire suite of services including financial planning, investment management, tax optimization, estate planning, and more to our valued clients.
Feel free to contact us at (832) 789-1100, [email protected], or click the button below to schedule your complimentary consultation today.
IMPORTANT DISCLOSURES:
Corporate benefits may change at any point in time. Be sure to consult with human resources and review Summary Plan Description(s) before implementing any strategy discussed herein.Rhame & Gorrell Wealth Management, LLC (“RGWM”) is an SEC registered investment adviser with its principal place of business in the State of Texas. Registration as an investment adviser is not an endorsement by securities regulators and does not imply that RGWM has attained a certain level of skill, training, or ability. This material has been prepared for informational purposes only, and is not intended to provide, and should not be relied on for, tax, legal or accounting advice. You should consult your own CPA or tax professional before engaging in any transaction. The effectiveness of any of the strategies described will depend on your individual situation and should not be construed as personalized investment advice. Past performance may not be indicative of future results and does not guarantee future positive returns.
For additional information about RGWM, including fees and services, send for our Firm Disclosure Brochures as set forth on Form ADV Part 2A and Part 3 by contacting the Firm directly. You can also access our Firm Brochures at www.adviserinfo.sec.gov. Please read the disclosure brochures carefully before you invest or send money.


