RGWM Market Thoughts – August 14, 2019
This morning marked what many television market pundits have noted as an ominous milestone: the inversion of the yield curve (this one focused on the difference in 10-year and 2-year U.S. Treasury yields) for the first time since 2006. Obviously, any data point characterized as being similar to the last recession produces natural feelings of doom and gloom. As one would expect, markets reacted poorly, opening up with the major stock indices down over 1.5%. This selling followed up a several-week period that has seen volatile swings in markets driven by economic data and corporate earnings releases, interest rate announcements and speculation, rising geopolitical tensions, and ebbs and flows in the US-China trade disputes; all material we discussed in detail in our previous newsletter.
In “normal” market situations, investors expect to be paid higher yields when taking on more risk. With bonds, much of the risk is associated with the term of investment. Longer term bonds are expected to pay more than shorter term bonds with all other factors held constant. In these normal market environments, the yield curve is upward sloping due to investors being properly paid for taking on higher risks. However, in cases of exceptional market uncertainty and volatility, investors flock towards the bond market from the stock market, a sign of a loss of confidence in the economy. They are willing to pay a premium for a safe harbor in the bond market that can result in yield differentials that don’t always make economic sense. In these cases, the prices of longer-term bonds rise to a point where they actually yield less than shorter term bonds resulting in what is called an inverted yield curve.
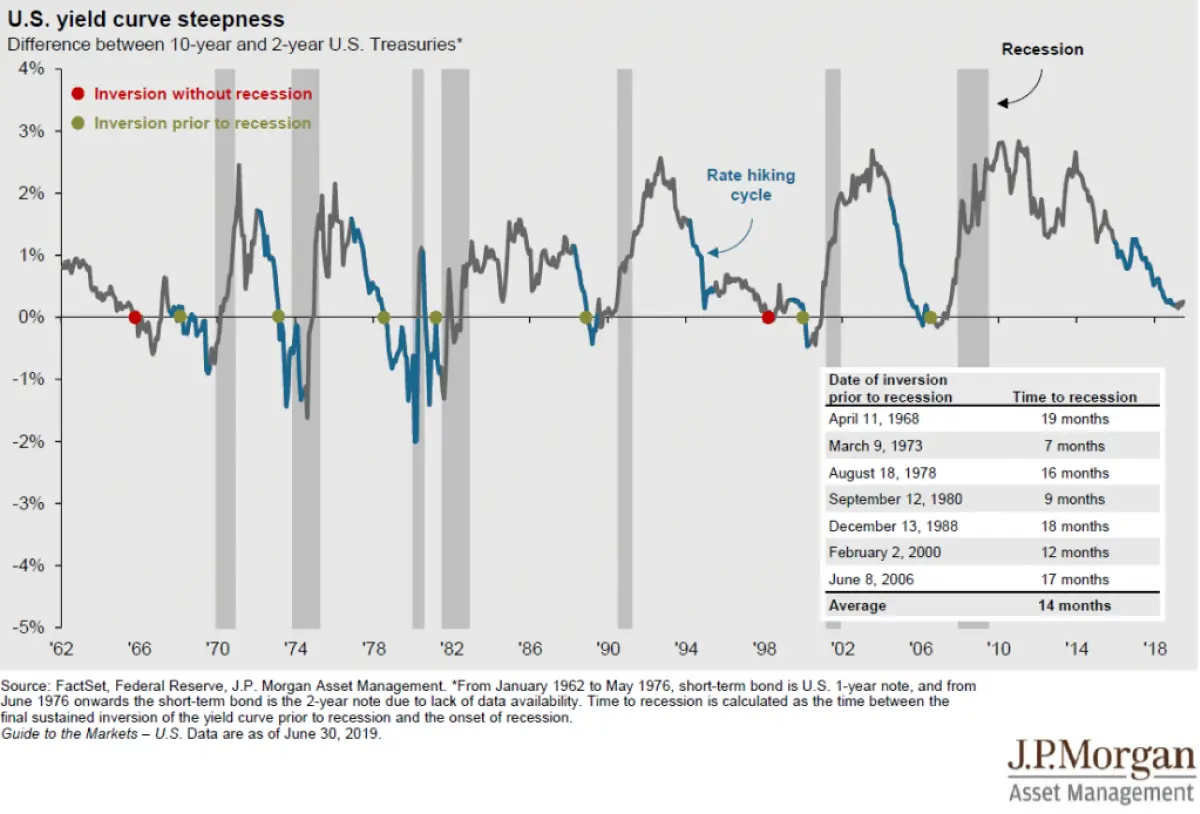
In the case of this morning’s news we are specifically focused on the difference between the 10-year and 2-year U.S. Treasury yields. In the previous seven recessions to hit the United States, all seven of them were preceded by the inversion of the 10-year/2-year Treasuries yield curve. That fact has been the focus of much discussion revolving around today’s market news cycle. However, when diving into the details there are several other accompanying questions that seemingly go unmentioned but are equally as important to discuss. Has every inversion 10-year/2-year yield curve resulted in a recession? How much time passed after the inversion before a recession occurred? What about the actual current yield levels relative to their historical yields? How did equity markets perform in the time leading up to recessions following an inversion?
In the case of the first question the answer is no; while the previous seven recessions all followed an inversion of the 10-year/2-year yield curve, there have actually been nine such recorded occurrences since the 1960s. In two of those nine inversions a recession did not arrive until after the curve normalized and an additional inversion occurred some time later. In the case of the early 2001 recession following the dot com bubble, the yield curve inverted not only in February of 2000 but also in June of 1998.
This leads us to the second question of how much time passes when a recession does follow a yield curve inversion. As seen in the chart below, it often takes several months and it has generally taken over a year. The average time to recession after the last 7 preceding inverted yield curves was 14 months. Our last recession, The Great Recession of 2008, occurred 17 months following the inversion of the 10-year/2-year yield curve. The shortest amount of time to recession occurred in March of 1973 when it took 7 months for the following recession to arrive.

As suggested in the third question, the yield curve only tells us how longer-term bonds compare to shorter term ones. They don’t tell us much contextually about the values themselves, which is still an important fact. The truth is that we are in unprecedented times when it comes to both interest rate levels and bond yields. The average 10-year Treasury yield during the last nine yield curve inversions was 6.11%. We are currently living in a 2% yield world, well below that enticingly high value. While the inverted yield curve demonstrates a current flight to safety, the historically low yield levels display a high price being paid for very little return. From a value investment standpoint, data as of July 31 shows that yields for S&P 500 stocks are actually at a discount to those for investment grade bonds relative to their 25-year averages (a 1.7% current spread relative to the 25-year average of -0.08%). A minor positive change in the current market news cycle could see a quick flight back towards more risky assets like stocks.
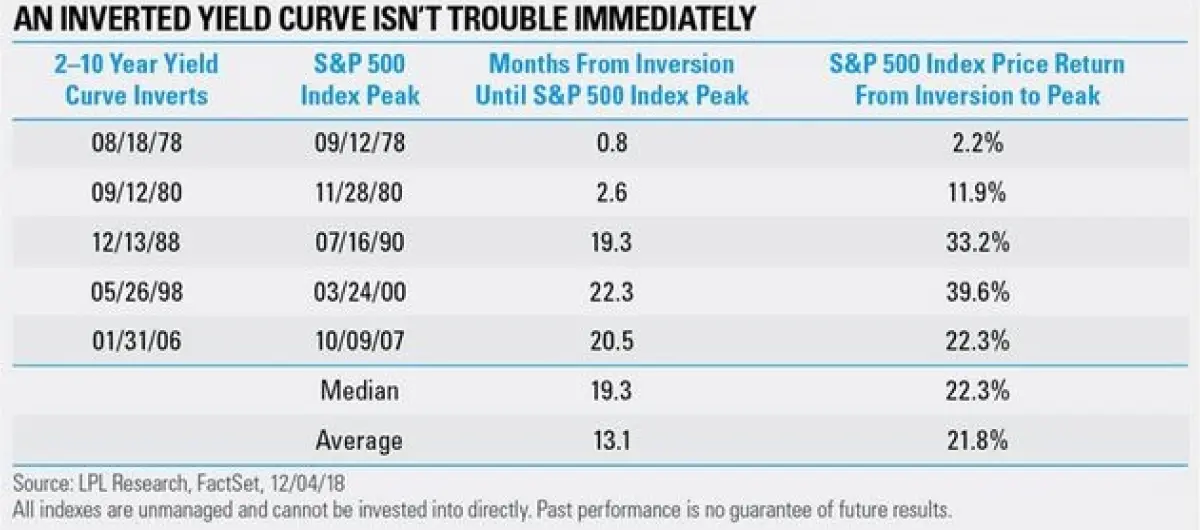
So how have stocks done in the months following an inversion? The simplest way to look at this is through market tops following the inversion. At what point relative to the inversion has the S&P 500 topped in overall value during the economic cycle? Historically, the market tops an average of 8 months following a yield curve inversion. However, the range of time it takes varies. When the yield curve inverted prior to the 2008 Great Recession, the market topped 20 months following the inversion of the yield curve. In contrast, the market topped 1 month after the inversion of the yield curve prior to the Oil Price crisis of the 1970s. The list of market tops relative to inversions can be seen below:

In summary, an inverted yield curve is an important data point that warrants paying attention to when evaluating where the market is in the business cycle. However, we cannot overlook the geopolitical, economic, and fundamental factors that are of equal or greater to the economic environment as well. Focusing on a single data point risks not seeing the forest through the trees. This is where risk management becomes key and maintaining a forward looking, well-diversified portfolio pays off. We will continue to monitor the markets and manage our portfolios in exactly this manner.
Need Some Help?
If you’d like some help from one of our CPAs or CERTIFIED FINANCIAL PLANNER (CFP®) advisors regarding this strategy and how it applies to you, the Rhame & Gorrell Wealth Management team is here to help.
Our experienced Wealth Managers facilitate our entire suite of services including financial planning, investment management, tax optimization, estate planning, and more to our valued clients.
Feel free to contact us at (832) 789-1100, [email protected], or click the button below to schedule your complimentary consultation today.
IMPORTANT DISCLOSURES:
Corporate benefits may change at any point in time. Be sure to consult with human resources and review Summary Plan Description(s) before implementing any strategy discussed herein.Rhame & Gorrell Wealth Management, LLC (“RGWM”) is an SEC registered investment adviser with its principal place of business in the State of Texas. Registration as an investment adviser is not an endorsement by securities regulators and does not imply that RGWM has attained a certain level of skill, training, or ability. This material has been prepared for informational purposes only, and is not intended to provide, and should not be relied on for, tax, legal or accounting advice. You should consult your own CPA or tax professional before engaging in any transaction. The effectiveness of any of the strategies described will depend on your individual situation and should not be construed as personalized investment advice. Past performance may not be indicative of future results and does not guarantee future positive returns.
For additional information about RGWM, including fees and services, send for our Firm Disclosure Brochures as set forth on Form ADV Part 2A and Part 3 by contacting the Firm directly. You can also access our Firm Brochures at www.adviserinfo.sec.gov. Please read the disclosure brochures carefully before you invest or send money.


