Market Snapshot August 8, 2022
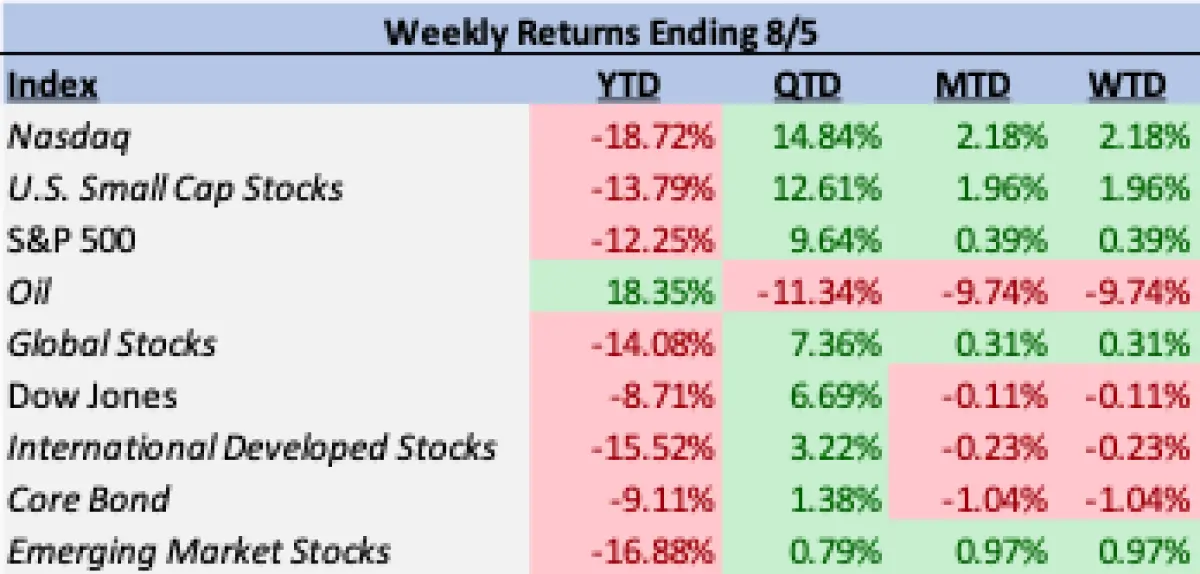
While last week didn’t have the blockbuster appeal of headline-grabbing economic news, it may have provided even more valuable context to the current market environment. It was a choppy week for the major stocks, with the S&P 500 finishing the week with a small gain of 0.39%. Within the large cap equity index, the rally in the consumer discretionary and technology sectors continued (1.17% and 2.00%) with additional participation from communications services (1.16%). The biggest laggard among sectors came from the energy space with a loss of -6.80%. Other trailing parts of U.S. large caps included the cyclical sectors of materials and real estate (-1.29% and -1.32%). When expanding beyond the domain of broad domestic large cap stocks, other equity subclasses had similar choppiness. The NASDAQ benefitted from its tech-heavy composition and ended the week with a 2.18% return. U.S. small cap stocks joined in on the rally and outperformed their large cap counterparts (1.96%). International and emerging market equities ended the week on separate sides of the gain/loss columns; with developed markets down on the week (-0.23%) and emerging markets notching a gain (0.97%). Driving the up and down week for equities was a volatile week in the bond market, which saw bond yields end the week higher and the core bond index closing Friday with a weekly loss of -1.04%.

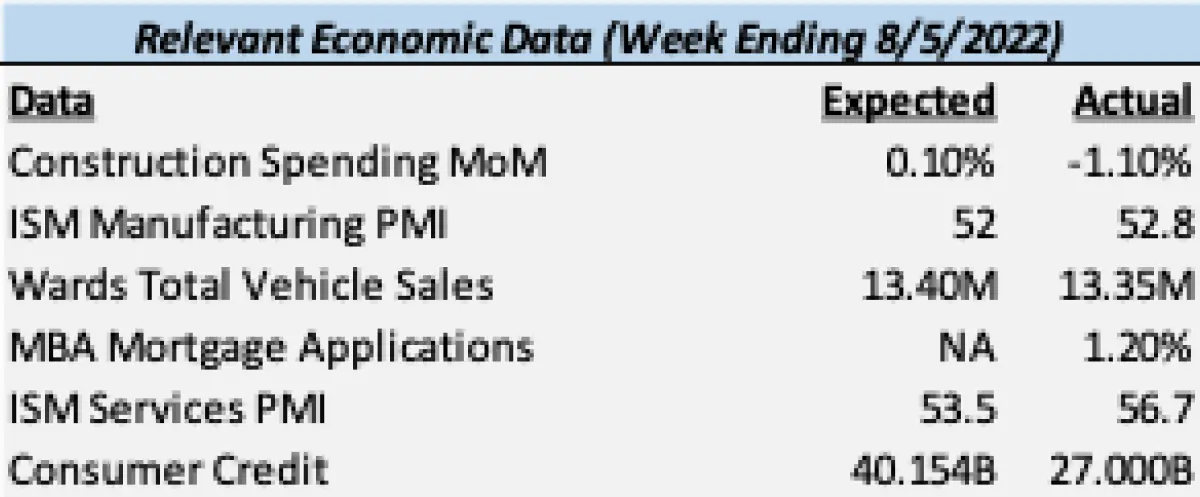
Following a week that included the second consecutive quarter of negative GDP and the Federal Reserve enacting a second consecutive “triple hike” (0.75%), this week’s economic reports headed into the week somewhat under-the-radar. The biggest data points last week came in the form of unemployment and labor-related reports. Before we dive into the compelling details found there, other metrics for the week included Monday’s ISM Manufacturing PMI. PMIs, or Purchasing Managers’ Indices, measure the amount of ordering activity in factories to provide a gauge for demand in the economy; they act as important leading economic indicators.
The ISM Manufacturing PMI reported a level of 52.8, which was above the estimated value of 52, and importantly, at a level above 50 which indicates an expanding (not a declining) manufacturing economy. Wednesday saw the first reports’ complementary data point, the ISM Services PMI, which, as the name suggests, provides a services linked indicator. This report also exceeded expectations with a 56.7 level, once again indicating expansion of economic activity.

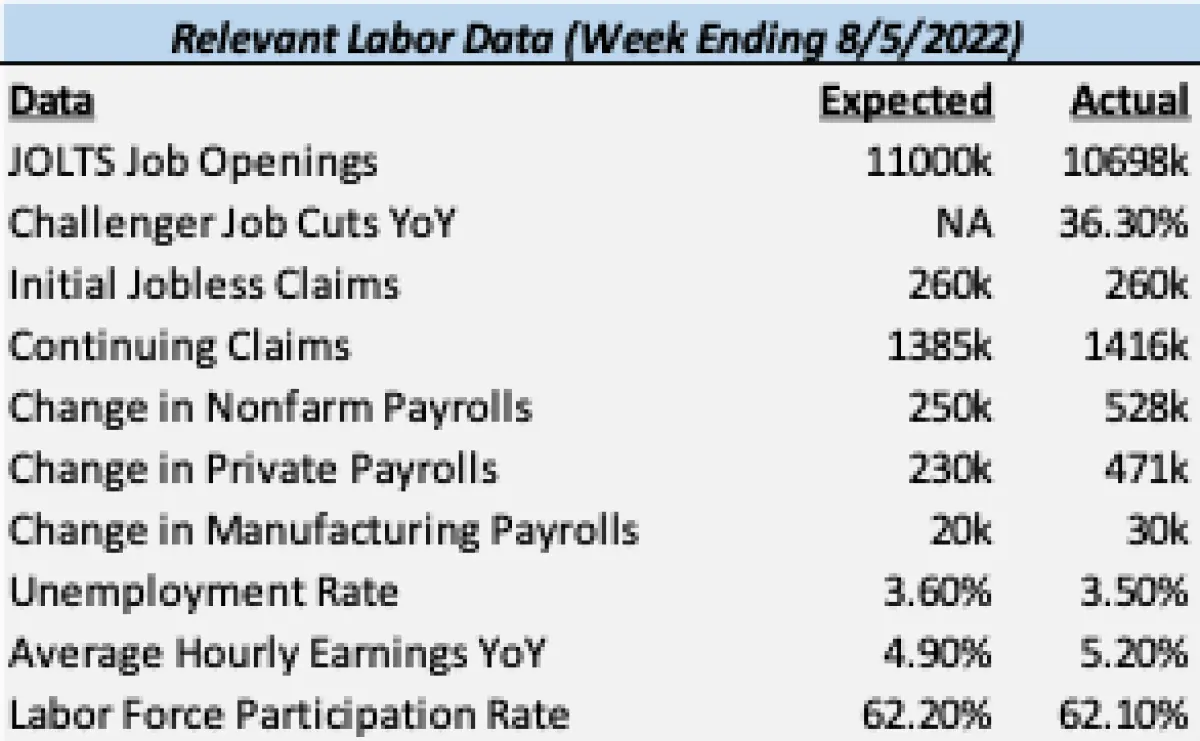
The PMI data outlined above may have seemed like some much needed optimism in the wake of the prior week’s recession fear raising GDP report, but stocks and bonds seemed to respond in a “good news is bad news” fashion by Friday’s end. What produced the strongest negative response from markets was Friday’s labor-related data (seen in the table below). Unemployment (for the period ending July) came in under expectation at 3.5%, which represented a decline in unemployment from June’s 3.6%. More surprising to markets may have been July’s change in “nonfarm payrolls,” the standard report for new jobs in the economy. According to the report, the economy added 528,000 jobs in July versus the 250,000 jobs expected. The report also saw a substantial upward revision in June’s numbers from 372,000 to 398,000 jobs for the previous month. The other big supplementary takeaways from the week’s labor data were a decline in job openings and a greater than expected increase year-over-year in hourly earnings.

While there were a few negative economic data points for the week, such as the slight decline in labor participation, a year-over-year increase in job cuts, and slowing spending in construction and vehicle sales, the overall data set painted a picture of a tight labor market and continued strength in overall economic activity. The difficulty for investors comes from how to interpret this data. At this point in time, market movements would indicate that the direction of inflation, fed policy, and interest rates continue to be the driving force for stocks. If the GDP data from two weeks ago pointed to the potential of the Federal Reserve to prematurely slow the hiking cycle, last week’s economic news did the opposite and reopened the door for a possible third “triple hike” in September. The activity in interest rate futures markets reflects this dynamic, as it went from pricing in interest rate cuts by February 2023 to now having the Fed hiking cycle reach next May. In addition to this, the market’s implied hike for this September went from 0.579% to 0.685%; this indicates the market now expects the probability of a 0.75% hike is higher than the prior consensus of 0.50%.
It’s important to once again note that the week-to-week and month-to-month nature of these data releases can be volatile, and the dynamic way in which they ultimately impact markets necessitates them being viewed together as a cohesive narrative. The week’s reports, when combined with the underlying components of GDP detailed in last week’s snapshot, show that while the economy in aggregate may have declined, many of the underlying important pieces, namely the labor market and consumer, remain strong to this point. This combination of resilient consumption and a tight labor market could point towards a more stubborn level of core inflation (CPI ex-food and energy) that may not come down as quickly as many in the market hope. Next week’s CPI report will provide another piece to this puzzle that will warrant attention. Before wrapping up this economic recap, another piece of data that caught our attention came from the jump in consumer credit balances reported on Friday. In this report from the Fed, consumer debt levels jumped by nearly $40 billion in the month of June, perhaps an additional sign of the stress inflation has placed on Americans.
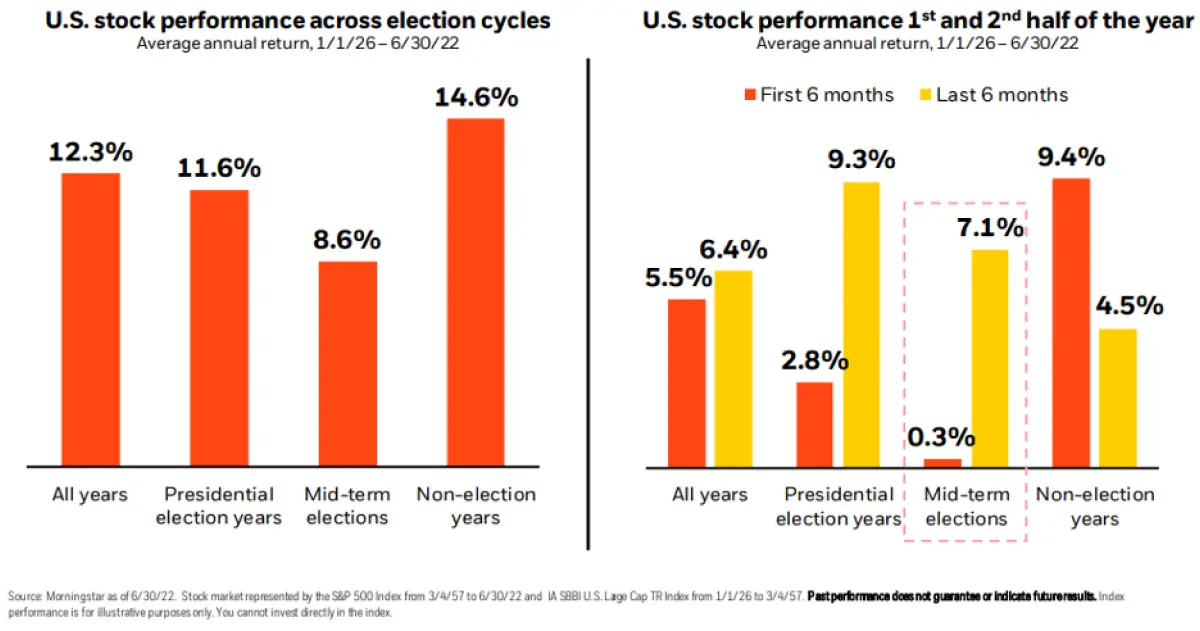
Our overall view continues to be that the primary determinant for the market will be the balance of inflation-related data, sentiment regarding the Federal Reserve’s policy direction, and the strength or weakness of the overall U.S. economy. Given that the next Federal Reserve meeting will not be until late September, there remains some opportunity for other factors to enter the fold as potential market movers. Tensions between the U.S. and China over Taiwan remain in the periphery at the moment, but as last week’s news cycle showed, the risk for escalation and a market moving event is certainly not zero and will be something we continue to cautiously watch. Another risk that we recognize as having the potential to influence markets is the upcoming midterm elections and the predictable partisan politicking that we can expect to hear more of in the coming months ahead. However, to end on a positive note, while it is true that U.S. stocks on average have performed worse in mid-term election years, most of that damage has typically come in the first six months. In fact, the last half of the year has often shown returns that outperform the average final six months in non-election years and the average of all years in general.

Given that we continue to see a plausible case for a continued second-half rally in stocks but also recognize the significant risks that exist in inflation, economic activity, and geopolitical tensions, a balanced risk-conscious strategy continues to be our point of focus. We expect this current complex backdrop of factors to continue to develop and change throughout this year, and as they do, we will continue to present you with these updates and our perspectives.
Need Some Help?
If you’d like some help from one of our CPAs or CERTIFIED FINANCIAL PLANNER (CFP®) advisors regarding this strategy and how it applies to you, the Rhame & Gorrell Wealth Management team is here to help.
Our experienced Wealth Managers facilitate our entire suite of services including financial planning, investment management, tax optimization, estate planning, and more to our valued clients.
Feel free to contact us at (832) 789-1100, [email protected], or click the button below to schedule your complimentary consultation today.
IMPORTANT DISCLOSURES:
Corporate benefits may change at any point in time. Be sure to consult with human resources and review Summary Plan Description(s) before implementing any strategy discussed herein.Rhame & Gorrell Wealth Management, LLC (“RGWM”) is an SEC registered investment adviser with its principal place of business in the State of Texas. Registration as an investment adviser is not an endorsement by securities regulators and does not imply that RGWM has attained a certain level of skill, training, or ability. This material has been prepared for informational purposes only, and is not intended to provide, and should not be relied on for, tax, legal or accounting advice. You should consult your own CPA or tax professional before engaging in any transaction. The effectiveness of any of the strategies described will depend on your individual situation and should not be construed as personalized investment advice. Past performance may not be indicative of future results and does not guarantee future positive returns.
For additional information about RGWM, including fees and services, send for our Firm Disclosure Brochures as set forth on Form ADV Part 2A and Part 3 by contacting the Firm directly. You can also access our Firm Brochures at www.adviserinfo.sec.gov. Please read the disclosure brochures carefully before you invest or send money.


