November 2024 Market Update
A Summary of Recent Market Activity, Economic Data, and Investment Perspectives on The U.S. Presidential election
We are a week removed from a market in October that saw a rise in volatility as investors grappled with a number of important variables. November began with a sharp rally in stocks in the wake of several of these uncertainties beginning to reach points of clarity.
We now know that former President Donald Trump is the President-elect. While the House of Representatives has multiple key races remaining, the incoming Republican administration will at minimum be accompanied by a majority in the Senate.
Furthermore, Thursday saw the Federal Reserve announce the second quarter-point federal funds rate reduction in what is hoped to be the early innings of an interest rate cutting cycle. In addition to these economic and political developments, the bulk of companies have reported earnings for the year’s third quarter, and the results have been largely better than expected.
There does, however, remain ample uncertainty in the world as markets will attempt to digest the implications of cabinet appointees and policy agenda items, along with key data points that could provide more insights into an economy that has continued to be strong but mixed in its interpreted trajectory.
The scale and magnitude of fiscal policy items such as tax changes, tariffs, and approach to trade partnerships have the potential for significant responses from markets in the future.
Despite these uncertainties, November’s early rally arrives in a part of the year with positive seasonality for stocks and strong historical returns heading into the holiday season.
Market Summary
Return data from Bloomberg
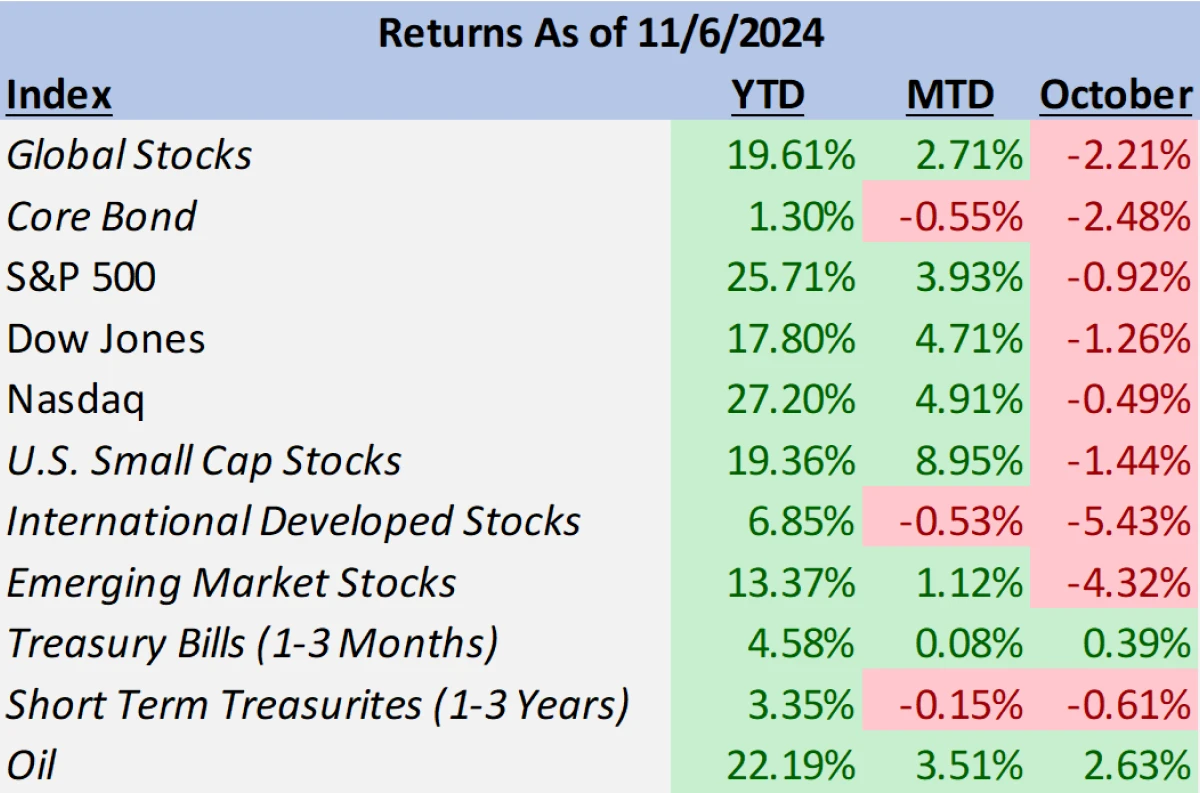
Global stocks closed October with a loss of -2.2%, but after having recovered the month’s losses, the MSCI ACWI remains nearly 20% higher for 2024. Detracting the most from markets was the performance of foreign stocks, as well as parts of the cyclical and value groups in the U.S. large cap stock market.
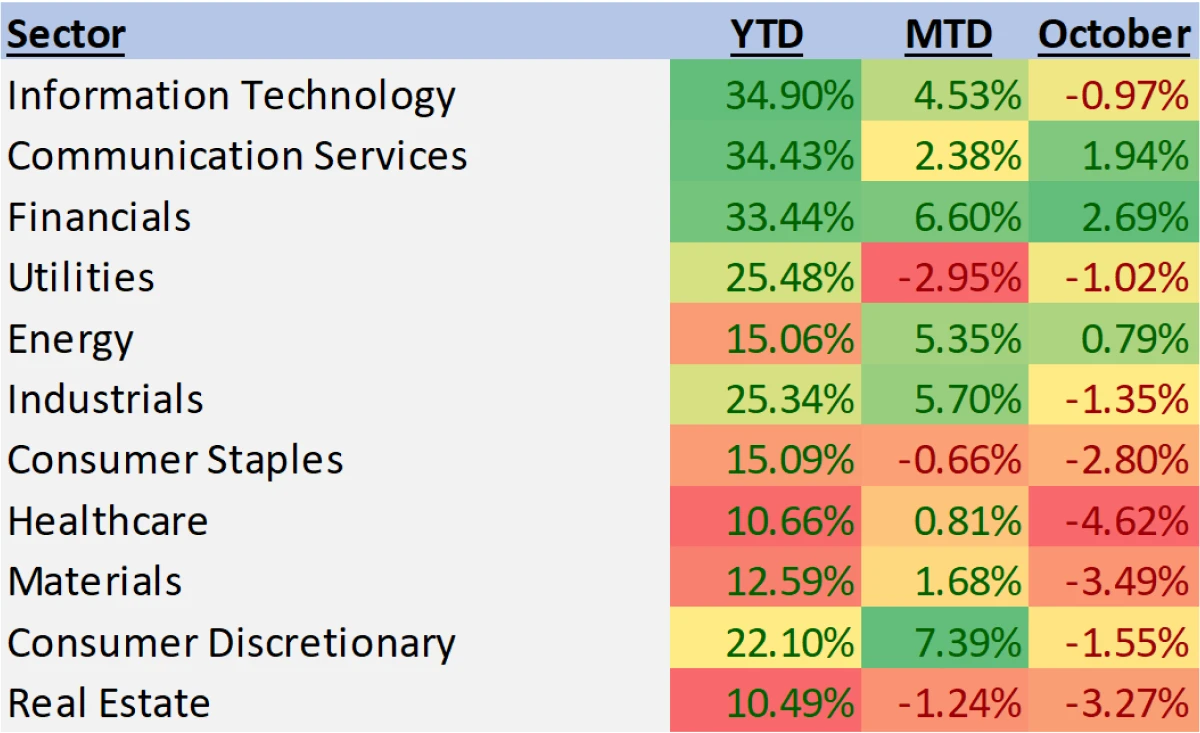
International developed and emerging market stocks were down -5.4% and -4.3% respectively. For the U.S., gains were produced in the financial (2.7%) and communication services (1.9%) sectors, but were more than offset by losses in healthcare (-4.6%), materials (-3.5%), and real estate (-3.3%).
The S&P 500 fell -0.9% for the month while the more value tilted Dow Jones fell -1.3%. U.S. small cap stocks fell -1.4%, underperforming their large cap counterparts.
Return data from Bloomberg
Alongside stocks, volatility rose in other asset markets. Bond yields fell for short-dated maturities while intermediate and long-dated yields rose, resulting in an overall flattening of the yield curve. The result was a monthly positive return for cash equivalent Treasury Bills (~0.4%) but a loss for the core bond index (-2.5%).
Core bonds remain nearly 1.9% higher for the year. Within the currency markets, the dollar strengthened significantly in October as the US Dollar Index rose nearly 2.75%.
November has seen some of these moves reverse and others continue. Stocks, as mentioned, have risen higher, led by a strong rally in U.S. equities. While relatively underperforming in October, small cap companies have risen significantly with returns month-to-date approaching 9%. Large cap companies have rallied as well, returning 3.9%.
International developed companies have fallen slightly while emerging markets have risen less than those in the U.S. (up 1.1%) as the dollar has continued higher for the month. Bonds have moved marginally lower by -0.5%.
October Volatility
In tandem with the rise in risk assets this month, volatility has moved sharply lower in early November. With the varying (albeit modest) declines across asset classes, it’s unsurprising that volatility in markets itself rose in October. The popular volatility gauges for stocks (VIX Index) and bonds (MOVE) each rose nearly 40% over October (38.43% for the VIX and 42.88% for the MOVE). With the exception of the VIX’s historic weeklong surge during August’s yen carry trade unwind, both volatility gauges were near their highs for 2024.
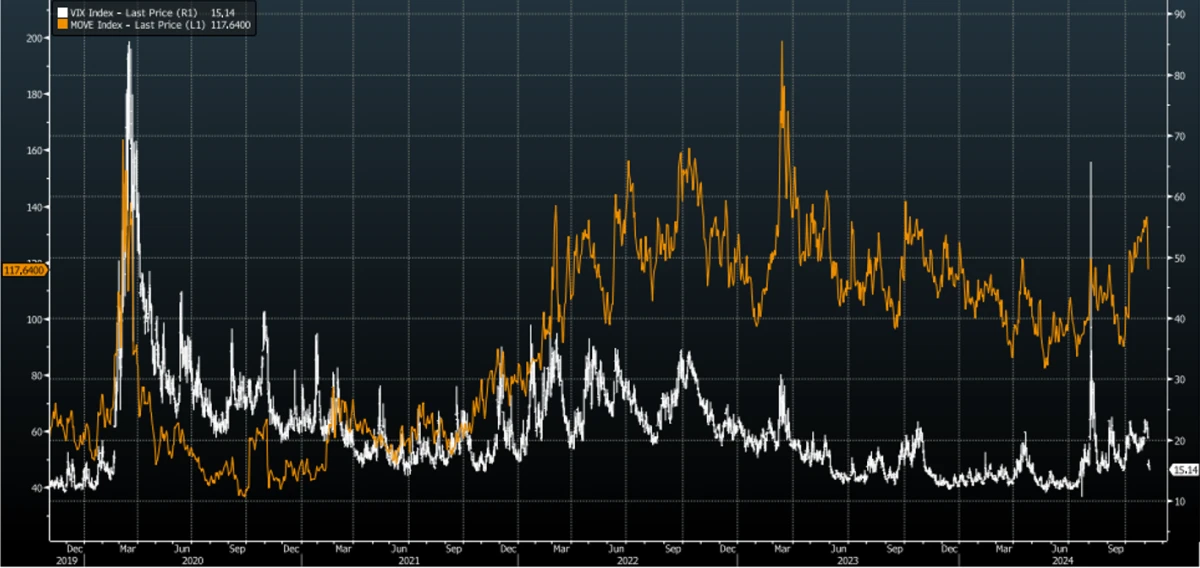
Daily VIX and MOVE Index Values Over 5-Years (Bloomberg)
For November, the declines in these volatility measures have been significant. The VIX has declined nearly 30% while the MOVE Index is approaching a 13% decline. When looking at equities specifically in election years, a rise in volatility prior to the election is often followed by these sorts of declines (typically a positive for stock returns) leading into inauguration day.
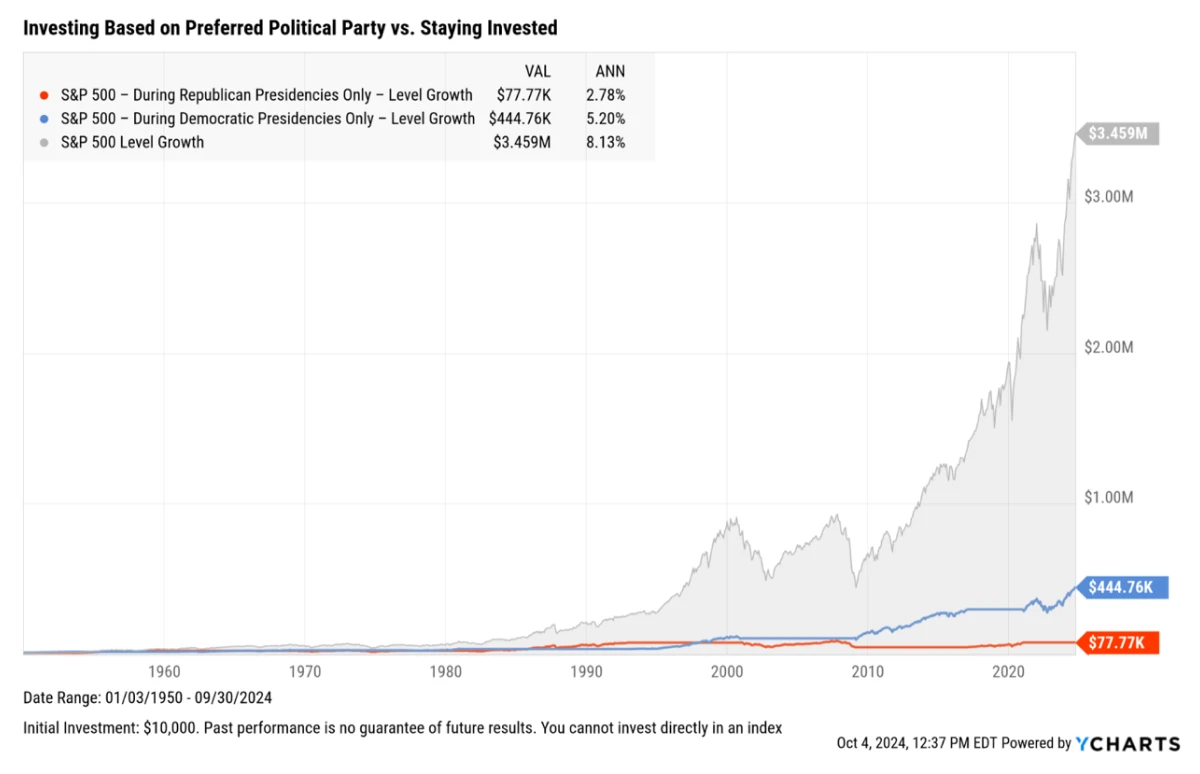
Chart and Data from YCHARTS
For bonds, the answer is more complicated. While the volatility in bonds experienced since 2022 has been the highest in the post Great Financial Crisis (GFC) era, the uniqueness of the current volatility level is greatly diminished when expanding the time frame to include the entire history of the MOVE Index (since 1987).
The post-GFC world (through the immediate aftermath of the COVID pandemic) saw global central banks cut interest rates to zero (and in some cases below zero) and hold them at that level for the majority of a decade. These low interest rates “dampened” volatility across many assets, including bonds.
Now that interest rates have risen to a positive real (inflation adjusted) level, we believe there is a strong probability that investors should expect a higher frequency of moderate volatility in bonds going forward.
The exceptionally low volatility in the 2010’s may have been the exception when taken into context of the last 37 years. The shift in the Federal Reserve’s direction towards a rate cutting cycle should assist in reducing the highest extent of the volatility seen in 2022 and 2023, but maintaining a balance of bond quality and diversified maturities will continue to be a key component in navigating the current environment.
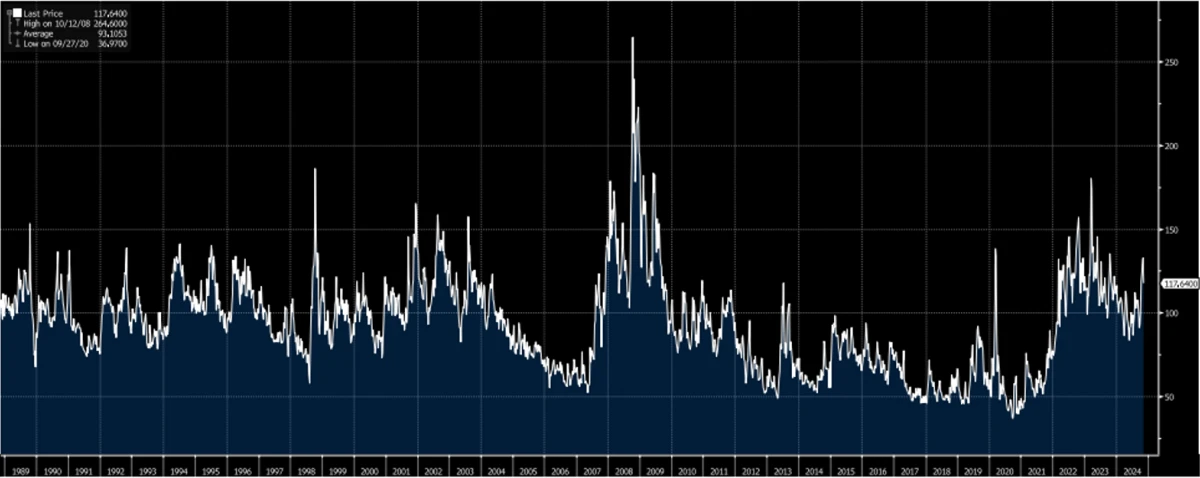
Weekly MOVE Index Value 1989-Present (Bloomberg)
Economic Update
As mentioned in our introduction, October saw a month pass where the focus of investor attention did not include an interest rate announcement. This, however, did not stop investors from speculating on what the Fed would do this month. The central bank’s decision to cut rates by 0.25% this week was essentially priced in by the time it was announced. However, driving much of the recent volatility in bonds has been speculation on Fed policy moving forward.
On October 1st, markets were pricing in 2.8 cuts through the end of 2024 and 7.7 cuts total through the end of 2025, bringing the expected terminal implied interest rate to 2.89% at the end of the cycle.
By the end of the month, just 1.75 cuts were priced into the market for 2024, with less than 5.2 cuts through the end of the cycle to an expected ending rate of 3.53%. In the aftermath of the Fed’s announcement and Powell’s press conference, the interest rate futures market has priced in 4.25 more cuts through the end of 2026 with a final rate destination of 3.51%.
This apparent whipsaw in interest rate expectations potentially has many motivating factors. There have been some arguments that some of the movement was from investors’ speculating on the election and positioning their portfolios for potential inflationary impacts from higher government spending and tariff policies.
When looking purely at the economic fundamentals, a few economic reports may also have played a role. September’s inflation data (from CPI, PPI, and the Fed’s preferred PCE) near universally reported either in-line or modestly higher than expectations. In particular, the year-over-year number for Core PCE was reported as 2.7% versus the 2.6% figure expected.
While this inflationary measure continues to be lower than the first half of the year, the rate of deceleration has stalled to being unchanged for the last three months. The Fed’s target inflation rate of 2% continues to be a material distance away.
The labor market’s data has been more mixed in its economic ramifications, but the most publicly profiled data point in unemployment remained at 4.1% for October, making the brief jump to 4.3% in July appear as an outlier not a trend. In addition, average hourly earnings saw a month over month increase that was higher than expected (0.4% vs 0.3% exp).
Finally, the October report for September’s retail sales showcased a stronger consumer than expected, with an increase of 0.7% ex auto and gas versus the forecasted 0.3%. An economy exemplified by a resilient consumer, sticky but slowing inflation, and a tight labor market neither sends potential recessionary signals nor begs dovishness from central banks.
However, that’s not to say that the entirety of the data released over the past weeks and month were without imperfections. GDP for Q3, while still strongly expansionary at 2.8%, decelerated from its 3% pace in Q2 and reported in at below the expected 2.9% quarter-over-quarter growth rate.
Beyond the October headline figure of 4.1% unemployment, the labor market reports showed several large misses relative to expectations to change in nonfarm payrolls (12k vs 100k exp), change in private payrolls (a -28k loss vs 70k added exp), and change in manufacturing payrolls (-30k lost vs -46k exp). On the surface these were alarming reports, but a number of seemingly unique factors bring major questions as to their representativeness of underlying weakness.
October saw several major disruptions to the normal functioning of labor markets from both weather related events and worker strikes. These disruptions are removed from the equation in measuring unemployment which, as mentioned earlier, remained at 4.1%.
On the weather-related front, Hurricane Helene occurred before the collection of October data, but its economic impacts are almost certainly still being sustained.
Hurricane Milton had a direct impact on the reporting period, but the Labor Department stated it was unable to gauge the effects on employment: “It is likely that payroll employment estimates in some industries were affected by the hurricanes; however, it is not possible to quantify the net effect on the over-the-month change in national employment, hours, or earnings estimates because the establishment survey is not designed to isolate effects from extreme weather events.”
The impact from the Boeing strikes is more clearly definable. The BLS stated that the strike likely cost 44,000 manufacturing jobs from the October payroll reports.
From a skeptical lens, it is worth noting that while payroll growth has been steady throughout 2024, a number of revisions have been made in each following period. In fact, of the 10 previous labor reports released this year, 7 of them have been adjusted to the downside the following month. These reports, on average, have seen a downward revision in payrolls of ~33k for a total of 331k jobs revised downward for 2024.
It is important to note that there were also three revisions this year upwards for payroll growth. Two of these positive revisions were substantial at 74k and 30k jobs added to the December 2023 and July 2024 reports. Revisions are not uncommon in these surveys and one can go back through history and look across multiple economic backdrops and government administrations to see a long history of changes to these numbers after the fact.
It is our belief that the reality for the economy is most likely somewhere in the middle of these various reports across all facets (growth, inflation, and labor). The labor market while tight is most likely feeling the impacts of the Fed’s sustained higher interest rate policies and will therefore continue to see a trend of slowing but healthy job growth as long as the policy regime maintains at a level that is suitably restrictive to current inflation.
The same is likely true with respect to economic growth and inflation itself. A Federal Funds target rate of 4.75% should continue to operate at a level restrictive relative to core PCE even if it were to be at its month-over-month pace of 0.3% (which would extrapolate to 3.6% over 12 months).
Within inflation, housing has continued to be the most consistently inelastic inflationary hot spot and given it holds a weight of over 18% in core PCE, a continued reduction from its current level of contribution (0.06% in September versus 0.08% in August and 0.1% in January) would go a long way in resolving what has been an extended struggle to return inflation near its target level.
Quarterly Earnings
Third-quarter earnings reports are approaching their end for the season, with 434 out of 500 companies having reported for the S&P 500. The results so far for the U.S. large cap index have continued to be largely positive in both absolute terms and relative to expectations.
As a group, the companies have increased earnings by 7.82% and produced sales growth of 5.14%. This represents a deceleration in growth from the previous quarter (where earnings and sales grew 10.28% and 5.25% respectively) but relative to expectations that had been revised downward heading into the season the index has produced positive surprises of 6.95% for earnings and 1.53% for sales.


2024 Q3 Sales and Earnings Surprises and Growth for S&P 500 by Sector (Bloomberg)
The biggest surprises this season have some from the communications services and consumer discretionary sectors. Communications services, led by Alphabet (GOOGL) and Meta Platforms (META), beat earnings expectations by nearly 14.7%. The consumer discretionary sector, led by e-commerce giant Amazon (AMZN), surprised on earnings to the tune of over 11.38%. Absolute earnings growth in these sectors have also led the index, with communications services and consumer discretionary growing earnings by 28.43% and 20.66% respectively to this point in the season.
A few sectors have tracked for earnings declines this quarter, including the materials (-7.4%), industrial (-8.87%), and energy (-24.42%) sectors. However, only materials out of that cadre have reported earnings results that were below expectations (-4.66%).
The Election
While the 2024 U.S. Presidential election has come to a close, there are still several races yet to be determined within the U.S. House of Representatives.
Betting markets (via Polymarket) are currently pricing in a 97% chance that the Republicans will retain control of the House, which when paired with the Presidency and Senate wins, would result in a “unified” Republican government. Even if the House goes the direction of the betting odds, margin of victory will be an important factor that could have ramifications on policy in both its implementation and magnitude.
Agenda items advertised in the campaign such as tax cuts, tariffs, deregulations, and spending priorities are likely to take more conceptual shape as we approach 2025. However, given the country’s recent experience with historically high inflation that has finally (and slowly) trended closer to normalcy, and the ongoing concern over the rising federal deficit, there exists the possibility that some Republicans may have some trepidations in pursuing aggressively stimulative policies.
Whenever the political and financial spaces intertwine, it understandably can bring a sense of anxiety and nervousness to those who pay close attention to the markets. However, as it pertains to the stock markets, time has tested corporate America across a wide range of political environments, Presidential administrations, and combinations of Congress, and the market has continuously proven its resiliency.
While we all have our own political beliefs, allowing them to dictate our approach to a financial plan or investment strategy can lead to poor outcomes. In fact, it is one that when taken to the extreme degree (staying out of the market entirely) has been proven by history to be very costly to investors.
When comparing the performance of the S&P 500 (8.13% annualized) to its performance when held only during a particular party’s President is in office, the return profiles drop significantly (5.2% for Democrat Presidents and 2.78% for Republican Presidents). These impacts are exacerbated by the loss of compounding returns.

Chart from YCHARTS
As described earlier, volatility has typically been higher in the lead up to election day. However, markets tend to respond positively once the uncertainty of the outcome has been alleviated. This has held true on average regardless of the various potential party combinations in the federal government.
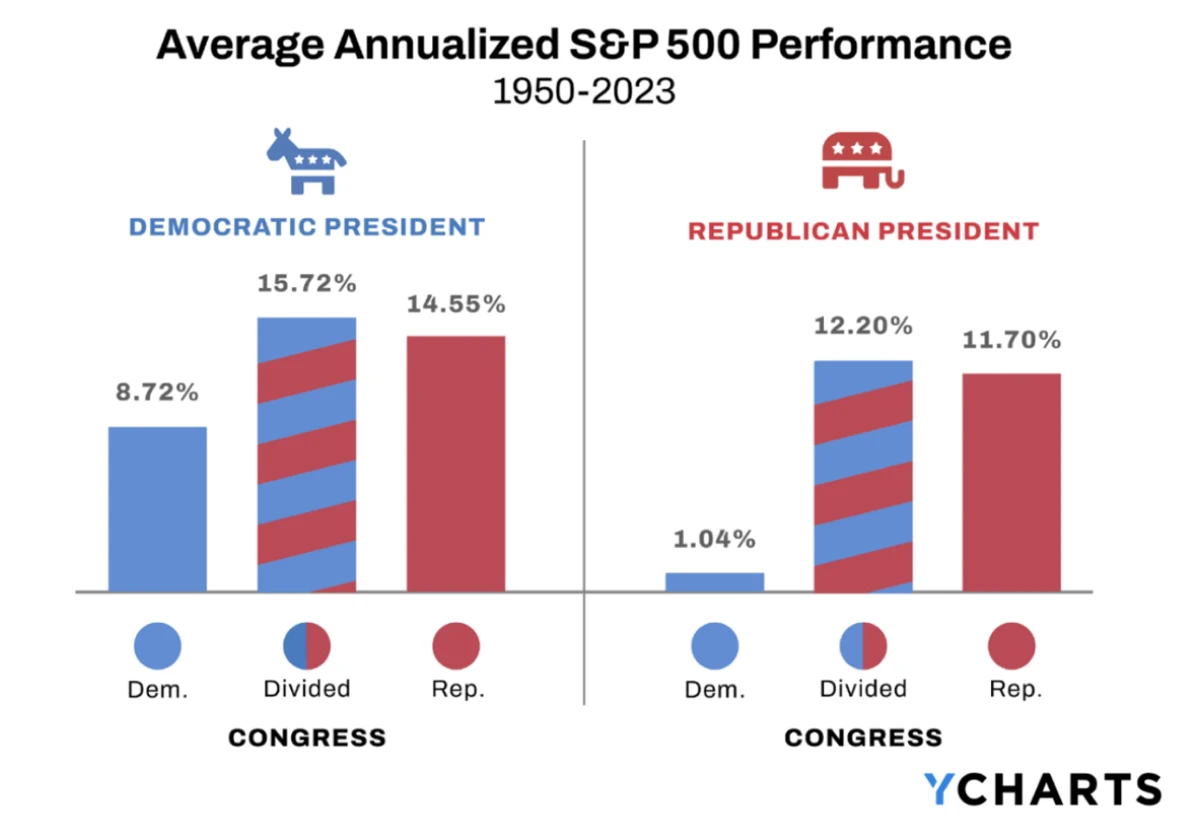
Chart from YCHARTS
Conclusion
As difficult as it may seem, when it comes to markets and the election, the time-tested solution for financial success remains staying invested and retaining exposure to the appropriate asset allocation tailored to one’s risk tolerance. Asset prices are driven by an expansive array of factors in the short-term, but in the long run the underlying fundamentals of the global economy and corporate earnings guide the path forward.
The current fundamentals on both sides of the equation, with a tight labor market, above trend economic growth, and corporate earnings execution, continue to be in an overall healthy state. For this reason, we continue to hold a constructive view of the market environment.
Need Some Help?
If you’d like some help from one of our CPAs or CERTIFIED FINANCIAL PLANNER (CFP®) advisors regarding this strategy and how it applies to you, the Rhame & Gorrell Wealth Management team is here to help.
Our experienced Wealth Managers facilitate our entire suite of services including financial planning, investment management, tax optimization, estate planning, and more to our valued clients.
Feel free to contact us at (832) 789-1100, [email protected], or click the button below to schedule your complimentary consultation today.
IMPORTANT DISCLOSURES:
Corporate benefits may change at any point in time. Be sure to consult with human resources and review Summary Plan Description(s) before implementing any strategy discussed herein.Rhame & Gorrell Wealth Management, LLC (“RGWM”) is an SEC registered investment adviser with its principal place of business in the State of Texas. Registration as an investment adviser is not an endorsement by securities regulators and does not imply that RGWM has attained a certain level of skill, training, or ability. This material has been prepared for informational purposes only, and is not intended to provide, and should not be relied on for, tax, legal or accounting advice. You should consult your own CPA or tax professional before engaging in any transaction. The effectiveness of any of the strategies described will depend on your individual situation and should not be construed as personalized investment advice. Past performance may not be indicative of future results and does not guarantee future positive returns.
For additional information about RGWM, including fees and services, send for our Firm Disclosure Brochures as set forth on Form ADV Part 2A and Part 3 by contacting the Firm directly. You can also access our Firm Brochures at www.adviserinfo.sec.gov. Please read the disclosure brochures carefully before you invest or send money.


