Market Update – March 2024
An Update On The Stock Market, Economic Conditions, and The Fed’s Latest Decision
Federal Reserve Decision
On Wednesday, the Federal Reserve announced their largely expected decision to leave the targeted Federal Funds rate unchanged at 5.5%. Leading into the announcement rate cut expectations had become more conservative (~2.9 cuts were priced into the interest rate futures market) following a series of worse than forecasted inflation data over the past two months.
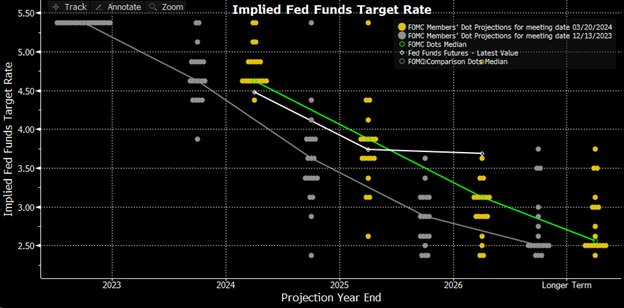
Despite the lower range of Fed members’ interest rate projections in the most recent dot plot (seen below) converging higher for 2024, the median projection for the end of year rate level remained the same signaling 3 rate cuts by the year’s end. Following the Fed’s announcement and Chairman Jerome Powell’s press conference, the futures’ market implied year end interest rate moved to ~3.3 cuts and markets moved higher across asset classes.
Stock Market Rally
The rally in stocks seen following the Fed announcement was a reaffirmation of a strong upward trend since the lows seen last October. While equity markets have broadly moved higher since that low in October, some subsets of stocks have been more challenged year-to-date.
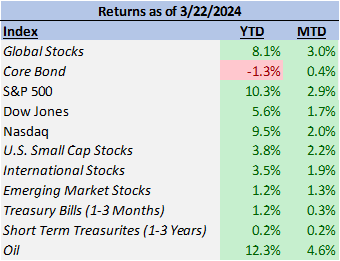
The S&P 500 has continued to lead the way as the strongest part of the equity market year-to-date having returned 10.3%. The biggest winners on a sector basis from the index have been communication services (16.42%) and information technology (14.02%) year-to-date, but the sector participation has been broad with financials (10.88%) and industrials (10.39%) also achieving double digit gains.
Energy has made a major rebound over the month of march as well with over 8% returns for the month bringing the year-to-date gain to 11.16%. The biggest performance outlier comes from the real estate sector, which has been the only loser year-to-date with a drag of -2.89%.
While financials, industrials, and energy have provided strong performance, there still has existed a disparity in performance between growth and value stocks.
Year-to-date the Russell 1000 Growth has outperformed the Russell 1000 Value by 4.85%; over a one-month period, value has gained back 1.39% of the overall lag in returns.
On a market cap basis, small caps have trailed the larger S&P 500 by 6.5% for the year. However, if one goes back to the October lows in the market (10/27), the performance between the two is closely in line with both having returned nearly 28% from the lows.
Also lagging the U.S. large cap stock market year-to-date have been international stocks (3.5%) and emerging markets (1.2%). A strengthening dollar has created headwinds for these companies. Such strong headwinds that even while international developed companies, when hedged, have kept pace with their US counterparts, currency drags have largely offset those returns.
Bonds have losses on the year of -1.3% as the 10-year Treasury yield has moved higher year-to-date. Yields are still well off of their October highs, with U.S. bonds having returned nearly 7% from 10/27 to now.
Inflation and CPI
While interest rate expectations have stayed top of mind for market participants in 2024, three straight months of above consensus CPI reports have elevated inflation concerns for investors. While CPI year-over-year has plummeted from its 9.1% peak rate in the summer of 2022, that deceleration has stalled since the summer of 2023 and has now fluctuated between 3-3.7% since last June. The 3% year-over-year rate in June has been the low.
February’s CPI report (released on 3/12) was the third in this series of above estimate misses. The year-over-year headline CPI was reported 3.2% versus 3.1% forecasted; this wasn’t quite as big of a miss as the previous two which each came in 0.2% higher than expected, but the 3.2% number represented an acceleration from the 3.1% year-over-year inflation reported for January.
Leading to the 3.2% year-over-year growth in CPI was a ~3.1% contribution from Core Services and ~0.3% contribution from Food prices. These contributions more than offset the actual decline in prices from Energy and Core Goods over the measured period. Of the major contribution from Core Services, about half of that came from the sub-category of “Owners’ Equivalent Rent” (1.5% contribution).
Sticky Inflation, Shelter Costs, and Owners’ Equivalent Rent
Owners’ Equivalent Rent has commonly been referred to as a “stickier” piece of inflation, one that tends to not fall as easily over time or fluctuate as quickly as energy, goods, or even other services.
The reasons for this “stickiness” are fairly intuitive. Explained by the Federal Reserve Economic Data’s website (“FRED”, created and maintained by the Federal Reserve Bank of St. Louis), rents only increase or decrease upon a lease’s renewal date or when a tenant moves, therefore it can be some period of time for the data displaying these markets to adjust to changes in conditions.
For the homeowners’ side of the equation, the rent equivalent is an attempt at estimation for what these homes would rent for and is often based off surveys of local renters. Owners’ Equivalent Rent also led to the higher expected reports from both the year-over-year and month-over-month Core CPI (ex food and energy).
On a rough annualized basis the average month-over-month rate of CPI is tracking to around 4%. An increase in the supply of apartment buildings along with projections from private data (such as from Zillow seen in the image below) is pointing towards the contributions from shelter costs to start working in consumers’ favor.
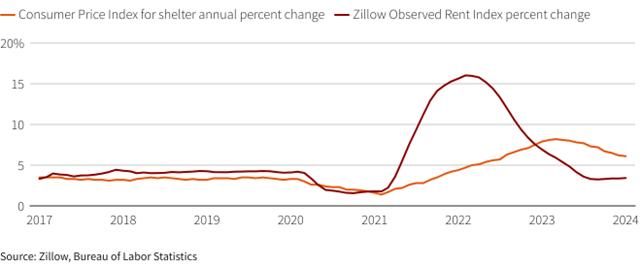 Graphic from Reuters
The wildcard in the inflation equation is the cost of energy, and more directly the price of oil. Since hitting a bottom of just over $68 (the 2023 high was over $93 in September) December and having worked mostly in consumers’ favor as detractor of inflation for the final quarter of last year, oil has risen back above $80.
Americans have already been feeling this increase, as the average price of gasoline (seen below) has risen from its low of $3 back up to $3.50 (still well off the $5 prices seen in 2022). With geopolitical issues and continued resilience in economic growth, the price of oil has once again become a critical variable to watch as both consumers and investors hope for further deceleration in inflation.
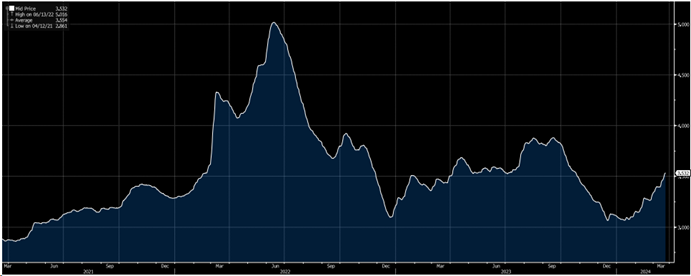 Daily National Average Gasoline Prices
GDP, Consumer Spending, and Economic Indicators
While GDP for the first quarter has yet to be determined, the Atlanta Fed’s “GDPNow” model, which is based off available economic data for the current measured quarter estimates GDP growth to be increasing at 2.1%. This 2.1% quarter-over-quarter growth rate remains higher than the average consensus estimate of 1.9%, but has substantially converged downward from the 4.2% tracking estimate seen in early February in our last market update.
One factor perhaps moving this estimate downward has been the back-to-back monthly downside surprises seen in retails sales. Retail sales for February which were released last week showed retail sales up 0.6% month-over-month for the measured period; a smaller increase than the expected 0.8%. In addition to this data, revisions were made to January’s retail sales report showing a decline for the month of -1.1% (originally reported at -0.8%), which was significantly weaker than the -0.2% survey expectation.
Retail sales are an important indicator when putting together models forecasting GDP due to its ties to consumer spending. While February’s rebound into positive territory was weaker than the forecasts, it was an important bounce back from the poor January report and enough to maintain our confidence in the consumer’s capacity to maintain economic activity.
Other economic indicators, such as the various Purchasing Managers Indices, have shown more variety in interpretation. Both the final reports for February and the estimated “flash” reports for March by S&P Global have shown continued expansion across the board from manufacturing, services and their combined composites. All but one of these reports also showed beats against economist expectations with the exception of the flash March report for US services which was 51.7 versus the forecasted 52.
ISM’s PMI’s have been more mixed, with the manufacturing portion showing a larger contraction for February than anticipated (47.8 vs 49.5) and services showing continued but weaker expansion than expected (52.6 vs 53). The contraction in manufacturing activity was largely driven by reported deterioration in the conditions of inventories and employment.
Of note, the manufacturing part of ISM PMI has been reporting contractionary activity since November 2022 while the services PMI has been in expansion since June 2020 for all but one month. Over two-thirds of the US economy is driven by the service economy, so while the continued deterioration in Manufacturing PMI’s is of concern, a still healthy expansion in Services is the more important piece to follow for the US economy broadly.
Labor Market
Finally in the economic data section, the labor market continues to be tight, but a rare miss to expectations came from February’s unemployment rate (reported early March) with the rate ticking up to 3.9%, above the forecast of it staying steady at 3.7%.
While the unemployment rate moved higher, jobs continued to be added to the economy at a higher-than-expected rate with both changes in nonfarm payrolls and changes in private payrolls showing 275k (200k expected) and 223k (165k expected) employees added in February. In line with the PMI data shown in the prior section, manufacturing payrolls reported a miss and showed job losses of 4k versus the 7k expected to be added.
More on the Fed
When examining all of this underlying economic data one begs the question as to how the Federal Reserve will interpret it in guiding the path for future interest rates and overall monetary policy. The latest announcement, dot plot release, and Powell’s own verbal statements have reaffirmed that the Fed is expecting to cut rates multiple times at some point this year. They will have the tough task of deciding which data matters the most and whether the changes in certain reports are signal or noise.
Ultimately, at the point when they do institute rate cuts, the Fed will be deciding that enough progress has been made in taming inflation for them to move more of their focus to accommodating and maintaining the labor market’s strength. After all, as the written official statement said, it is a dual mandate of “maximum employment and inflation at the rate of 2 percent over the longer run” that they wish to accomplish.
As a hint as to what to expect, Chairman Powell described the current status of the economy and the Fed’s current outlook as follows:
“The economy is strong, inflation has come way down, and that gives us the ability to approach this question carefully and feel more confident that inflation is moving down sustainably at 2% when we take that step to begin dialing back our restrictive policy.”
The Fed’s adjustments to their forecast back up this statement. They raised their projections for GDP growth this year to 2.1%, well above the prior 1.4% in December. The unemployment forecast moved lower to 4% and, most importantly at the moment, their estimate for the core personal consumption expenditures (Core PCE; their inflation target metric) moved up to 2.6% (up from the 2.4% forecast).
What this signals is both interesting and perhaps even insightful. For one, the Fed has raised its forecasts in directions that would (if not given their interest rate projections to the contrary) suggest a more hawkish not dovish monetary policy environment.
Higher economic growth, a tighter labor market, and higher inflation is hardly a cocktail for a dovish interest rate framework. While these forecast changes did have some hawkish impacts on the Fed, the lowest FOMC member rate projection did move higher and closer to the median, it did not result in the median rate forecast itself moving higher.
Secondly, the forecasted economic data points are largely in line or at least close to where the latest reference metrics currently stand. The 2.1% growth estimate is in line with GDPNow’s forecast for Q1, the unemployment rate of 4% is just 0.1% higher than the latest unemployment figure, and the Core PCE forecast of 2.6% is just 0.2% lower than the prior PCE reading from the end of February.
Taken together, one could speculate that conditions don’t have to dramatically improve to achieve what’s necessary for the Fed to institute its planned cuts. Also of note on the Core PCE portion of inflation, this metric does not include energy prices which is of largest concern right now as a broader inflationary headwind.
While it seems that economic conditions do not need to dramatically weaken from their current point to bring the market’s wanted rate cuts, the key risk to reaching the destination is inflation doing the opposite and moving higher. Within the Core PCE metric, the biggest culprit to the current above target inflation level have been, similarly to CPI, housing and rents; the second biggest contributor being health care.
Housing costs slowing alone would likely be enough at this point to bring Core PCE to the 2.6% forecast. The biggest risks to that being fulfilled would be a pickup in the contribution from durable goods (which have detracted from PCE lately).
Additionally, how the Fed would react to a sudden unexpected surge in energy prices is a question less clear given those costs aren’t included in their target inflation metric but would still be felt by consumers and the economy. For now though, the path to a soft landing continues to be a strong possibility and we appear to be headed in that direction if the data unfolds as both the consensus of industry economists and the Fed expects.
Conclusion: Looking Ahead at the Risks and Opportunities
In conclusion, we remain optimistic of the current market environment, with the latest decision from the Fed and overall composition of the recent economic data reinforcing that outlook. Of course, this positive set up is not without its risks and we do anticipate some moments of volatility to show up even without a significant adverse change occurring to the backdrop.
The inflation data over the next couple of months will be of critical importance to the both the market maintaining its positive momentum and the Fed’s plans to cut interest rates. While we do not anticipate it, if the inflation data continues to run above expectations or worsens, it could result in a repricing of interest rate expectations and volatility. External shocks and factors such as geopolitical events are always a possibility, and the risks for these escalating tensions are higher now than in the recent past.
Of course, there’s also the fact that we are in a Presidential election year here in the U.S., and moments of temporary market uncertainty surrounding it wouldn’t be surprising.
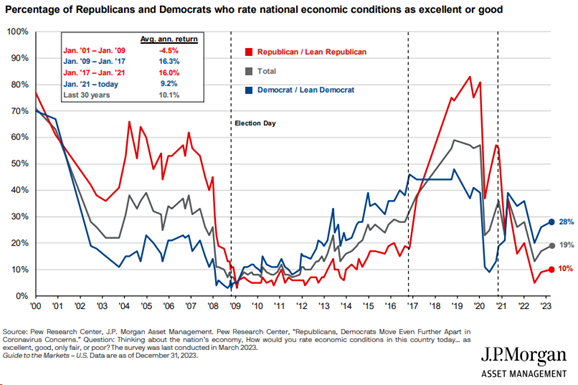
We’ll likely be putting more focus on market dynamics in elections in future newsletters but below is an interesting graph that shows how letting politics dictate one’s overall level of investment can get in the way of strong returns. When a political candidate gains control of the office, those in the opposing party tend to feel poorly about the economy while the market continues to produce positive returns regardless of who has the presidency.
Finally, as the first quarter of 2024 closes and the second quarter begins, we’ll be monitoring and diving into the many earnings releases to come. They will provide a lot of insights into how corporate America is navigating the current environment and the economic opportunities and challenges in place. The market is currently expecting Q1 earnings growth in the S&P 500 of 3.4% which would be the third straight quarter of year-over-year earnings growth for the index.
Need Some Help?
If you want to discuss your financial position with knowledgeable professionals who can help you identify and overcome ways to best maneuver volatile markets, please feel free to reach out to us here at Rhame & Gorrell Wealth Management for a complimentary financial plan review.
Our CPA, CFA, and CERTIFIED FINANCIAL PLANNER (CFP®) professionals have years of experience and are happy to help answer any retirement questions you might have.
We can help you review your financial and tax situation and come up with a custom strategy going forward.
Feel free to contact us at (832) 789-1100, [email protected], or click the button below to ask a question or schedule your complimentary strategy session today.
IMPORTANT DISCLOSURES:
Rhame & Gorrell Wealth Management, LLC (“RGWM”) is an SEC registered investment adviser with its principal place of business in the State of Texas. Registration as an investment adviser is not an endorsement by securities regulators and does not imply that RGWM has attained a certain level of skill, training, or ability.
This material has been prepared for informational purposes only and should not be construed as personalized investment advice. Past performance may not be indicative of future results and does not guarantee future positive returns.
For additional information about RGWM, including fees and services, send for our Firm Disclosure Brochures as set forth on Form ADV Part 2A and Part 3 by contacting the Firm directly. You can also access our Firm Brochures at www.adviserinfo.sec.gov. Please read the disclosure brochures carefully before you invest or send money.


