September 2024 Market Update
September has seen a continuation of the moderate rise in volatility since the middle of July. While the S&P 500 had nearly recouped all of the 8.5% pullback from its all-time high set earlier this summer, this month has seen a pause in that rally as investors await a highly anticipated first potential rate cut and a slew of economic data. Market participants have understandably been cautious in the current environment, as multiple factors – ranging from political, to seasonal, to economic and fundamental – have raised the level of uncertainty. This cautiousness has been evident despite all indications from the Federal Reserve suggesting that a dovish shift in monetary policy is on the way.
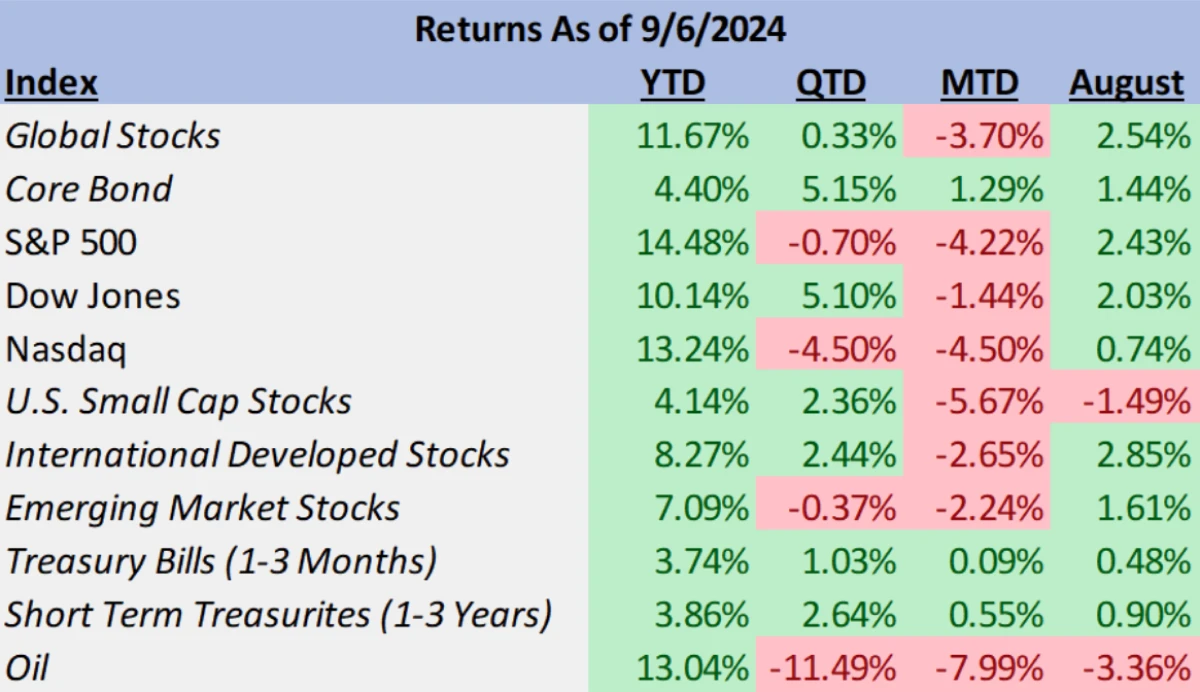
With the exception of small caps (-1.49% on the Russell 2000), August saw markets see similarly modest gains across most asset classes.Global stocks (MSCI All Country World Index; including both U.S. and International companies), produced positive returns of 2.54% for the month with international stocks (2.85%) outperforming their U.S. counterparts in the S&P 500 (2.43%). A relative weakening in the dollar contributed to this foreign outperformance of domestic equities. Core bonds, in conjunction with lower yields, produced similarly positive returns for the month (1.44%).

However, August’s bottom-line results only tell a fraction of the story for markets. The journey to the mundane but positive destination is a large reason for the current cautiousness held by investors today. August began with stocks continuing their slide from July, with poor economic news and technical trading factors (connected to the widely discussed Yen “carry trade”) producing bearish sentiment and fears that the pullback could evolve into a correction (a decline of more than 10%). Our belief was and continues to be that the declines experienced lately are set to be temporary and have been nothing out of the ordinary. With an average of 4.6 pullbacks of at least 5% per year, most moments of volatility in the stock market are simply the risks taken in having the prospect of long-term gains (source). That’s not to say that there were no surprising or noteworthy elements regarding the nature of the selloff in August. While the depth of the decline to this point (for the S&P 500) has not reached correction territory, the magnitude of volatility on August 5th was historic, with the VIX (Chicago Board Options Exchange’s CBOE Index) volatility measure experiencing its largest single day gain in history. Although well off the highs of August 5th, the VIX continues to be elevated relative to the low levels that have dominated 2024. Given seasonality (September has frequently, but not always, been a choppy time of year for stocks) and uncertainty in the economic, labor market, and election related backdrop, volatility could potentially remain elevated as we head into a remainder of the year which will bring more clarity into the Fed’s rate cutting cycle.
The Yen Carry Trade
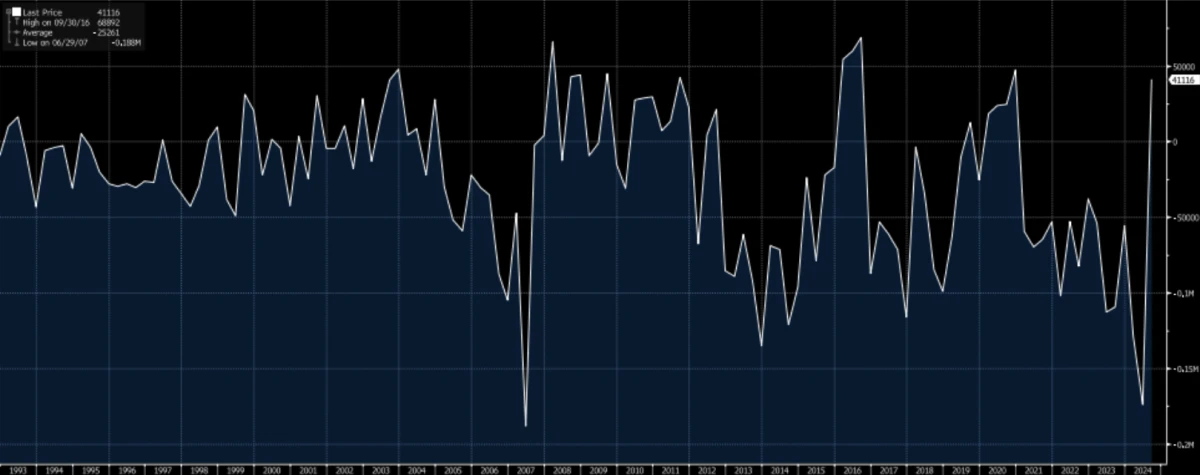
There is evidence though that the one-day radical spike in volatility was an anomaly that is not likely to characterize the market to such a substantial degree. As mentioned earlier, a much-highlighted feature driving the sell-off was a reversal in the yen “carry trade.” Carry trades are a popular investment strategy by institutional traders, such as hedge funds, that involve borrowing (or shorting) a lower yielding currency to purchase assets denominated in higher yielding currencies. When this strategy works, investors can capture both the return on the asset and profit from the interest rate differential. For decades the Japanese yen has been a reliable vehicle to fund these carry trades, given its globally relatively low-interest rate yield and the Bank of Japan’s dovish policy backdrop. Since the middle of July, a combination of weaker economic data in the U.S. (suggesting the Fed would begin the interest rate cutting cycle) and the BOJ’s decision to hike rates saw the US dollar’s trend in strengthening relative to the Yen reverse itself. This reversal resulted in a rapid “unwinding” of carry trades that hit both the US and Japanese stock markets as investors involved in these carry trades sold their long positions in higher expected return-oriented investments (stocks being one group) to close out their short positions in yen. For those involved in the derivatives market (funding carry trades through shorting yen futures), the strengthening of the yen created or neared necessitating a margin call that forced traders to liquidate positions. At least in the short-term, a sizable portion of the unwinding (and perhaps the most volatile aspects of it) has been completed. On July 2nd, speculative investors were shorting a net of 190,000 Yen futures contracts (~$15.6 billion in value), essentially betting on the yen to weaken (Jeffrey Kleintop, Charles Schwab).Today, as seen below, that position has flipped to a net long of over 41,100 yen contracts.Just how long investors are willing to go in this market is uncertain, but the flip from a deep net short position back into positive positioning is evident of substantial progress made in resetting the market environment.

Net CME Japanese Yen Futures Contracts (Bloomberg)
There are certainly other avenues where investors are positioned in carry trades, including loans from Japanese banks and Japanese investors themselves who may be overallocated to foreign assets, but the path taken to unwind these positions is not as likely to be as urgent or one-sided as that displayed in the derivatives market.
The Federal Reserve and Fixed Income Markets
Top of mind for investors is the Federal Reserve’s upcoming September 18th meeting, their first since the end of July. The market consensus heavily favors the initiation of a rate cutting cycle with a single 0.25% rate cut now fully priced in and a double cut (0.50%) nearing a 30% probability. The level of certainty appears warranted, as Federal Reserve Chair Jerome Powell all but declared that policy easing was on the way stating, “the time has come for policy to adjust” with the soft caveat that “the timing and pace of rate cuts will depend on incoming data.” The most significant shift in Powell’s rhetoric under the surface was an indication that the Fed’s focus has explicitly shifted from reducing inflation to maintaining strength in the labor market. This being demonstrated through comments such as “inflation has declined significantly”, “the balance of risks to [its] two mandates has changed”, and that the Fed “will do everything [it] can” to make sure the labor market stays strong and the taming of inflation continues.
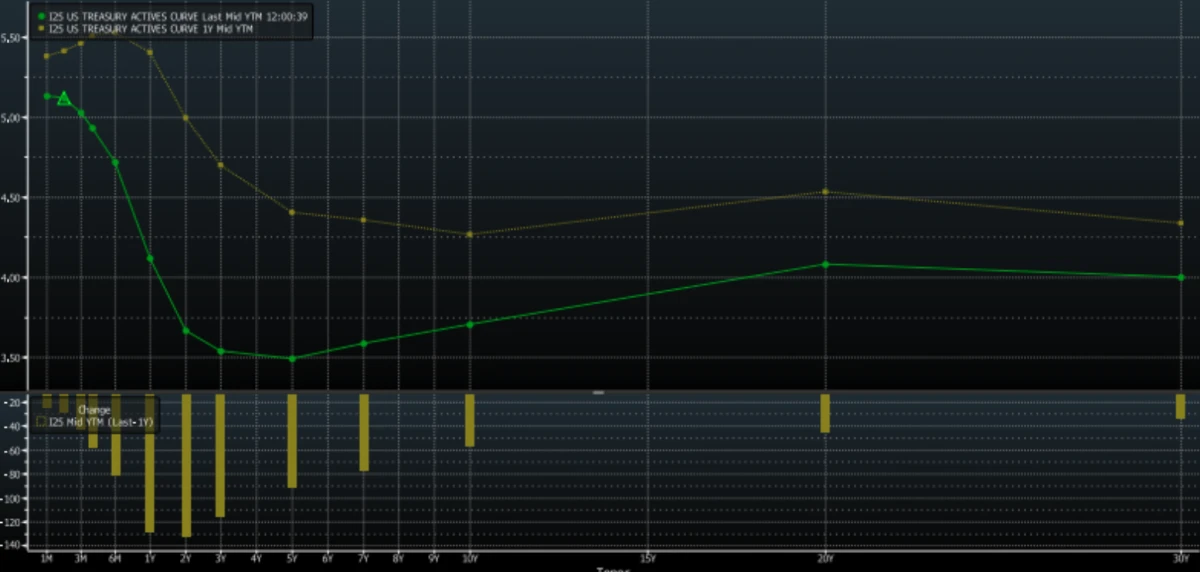
A successful navigation of these goals, bringing inflation to 2% and maintaining full employment without experiencing a recession would be emblematic of the much discussed “soft landing” goal. While the stock market has yet to fully buy into this narrative (one would expect a return to all-time highs and continuation of 2024’s positive trend), the bond and interest rate futures markets are close. The trajectory of rate cuts displayed by Fed Funds futures shows that of a slow and consistent rate cutting cycle ending in Spring of 2026 at a final destination rate of 3%. This would be 2.5% below the current target rate and a total of 10 (25 bps) cuts over 13 meetings, or an average of just under 1 cut per meeting. While the market suggests a “double cut” could be embedded somewhere between this year’s September and November meetings, the overall trajectory is expected to be a gradual easing of policy over the next year and a half. The bond market itself has also shown signs of normalizing. The yield curve has begun to normalize from a state of inversion and steepen over the past year, with the 10-year yield now at a level slightly higher than its 2-year counterpart as short-term rates have begun falling at a larger pace than the long end of the curve. Contrary to its naming convention, this “bull steepening” in rates (lower yields overall, shorter-term falling more than longer-term) can be a bearish indicator for the economy when rates are expected to fall in service of stimulating the economy. The magnitude of these relative moves in yields however do not imply the “deep cutting” of interest rates that would accompany central bank policies utilized in countering recessions, and more in-line with what we’d expect to be the gradual cutting cycle playing out in a soft-landing scenario. The ongoing yield curve steepening process will be an important economic indicator we will continue to closely watch.

Present Yield Curve Compared to 1-Year Prior (Bloomberg)
These changes to the structure of the yield curve do suggest an opportunity for investors to add duration, as the term structure of interest rates has returned to an economically rational orientation, with longer-term bonds now paying coupons that at minimum compete with their short-term counterparts. With both current inflation and inflation expectations now closer to target levels, duration is expected to provide diversification benefits to a balanced portfolio.
The Economy
Of course, for the soft-landing scenario to play out the economic data will have to validate the market’s current positioning. While that data has provided more clarity on one side of the equation (inflation), the other portion of the Fed’s mandate (labor) has shown more weakness in recent months. Since a spike up to 0.4% in January (released February), the Fed’s preferred measure of inflation, core PCE, has trended lower to an average rate of under 0.22% month-over-month which is on pace for a 2.6% annual rate. The last two reports for June and July have each been 0.2%, which annualizes to ~2.4%. The more publicly known core metric of CPI ex Food and Energy has also trended lower in recent months with the last reading in July reporting a 0.2% month-over-month growth number (2.4% annualized) and the last six reports averaging to an annualized rate of 3.2%. If one were to add an additional significant digit to July’s number, it would be 0.165% and annualize to a rate of 1.98% which is slightly below the Fed’s target of 2% inflation. July’s Core PCE monthly figure unrounded was 0.161% or 1.93% annual. With another CPI report (for August) set to release this Wednesday, the trend in the data has seemingly reached the desired target of the Federal Reserve, with the lagging impacts of housing likely yet to contribute in a beneficial manner.
While notching in as another miss versus expectations, last Friday saw August’s change in nonfarm payrolls bounce back from a very poor July report. August’s jobs data release showed 142k jobs added for the month versus the consensus expectation of 163k and last month’s gain of 89k (revised lower than the already low first reading of 114k). Despite being lower than economist expectations, August’s job growth represented an encouraging acceleration in comparison to a weak July report characterized by some unique exogenous factors (such as Hurricane Beryl). Unfortunately, the past month has seen substantial revisions to this year’s labor data that clearly suggests that recent labor market weakening cannot be denied or explained away as minor abnormal data points. Late August saw the Bureau of Labor Statistics, in its annual benchmark revisions, lower nonfarm payroll growth by 818k over the 12-month period through March 2024. As mentioned earlier, the latest payroll report showed a revision in the July data from 114k to 89k, as well as a revision to the June data of 61k jobs, bringing the June period to just 118k jobs added. A deceleration of payroll growth often leads to a rise in layoffs, which to this point have been historically low and one of the key pieces of evidence against both recession risk and in favor of the soft landing. There is however rising potential for layoffs to pick up before the end of the year. While initial jobless claims have yet to significantly rise, the latest Challenger Job Cuts survey rose to its highest total for the month in 15 years, with companies announcing plans to layoff 75,891 workers while adding just 6,101 new jobs. Technology led sectors in layoffs, with responsibility for over half of the announced job cuts.
The difficulty in interpreting this latest labor market data lies in the fact that many of the same signals that trigger concern (rising layoffs and softening job growth) are the same pieces of data that would also occur in the process of normalization towards a soft landing.The labor market has been operating in historically tight conditions for over two years, and the economically rational impacts of Fed monetary policy meant to counteract inflation are the same policies that in turn cool the labor market.These recent signals from the labor market data are not alarming to us yet but do warrant ongoing monitoring and caution.They further suggest that the Federal Reserve should begin the interest rate cutting cycle, and raises the possibility that the Fed may “front-load” its policy shift by cutting 0.50% during a meeting this year.
Earnings
Earnings season has nearly reached its conclusion with 497 of 500 companies having reported their second quarter results. All in all, the quarter could largely be considered a success with the index in aggregate producing sales and earnings growth greater than 5% and 11% respectively. Both the top-line and bottom-line surprised to the upside with sales modestly surprising ~0.8% above consensus while earnings solidly beating expectations by over 5%. Top standout sectors included financials and utilities beating their earnings estimates by double digit percentages (10.14% and 13.72% respectively) while communications services provided the only downside earnings surprise (missing estimates by -9.72%). In absolute growth terms, technology continued to outperform the broader market with sales growth of ~11.3% and earnings growth of ~21.2%.


S&P 500 Sales & Earnings Growth (Bloomberg)
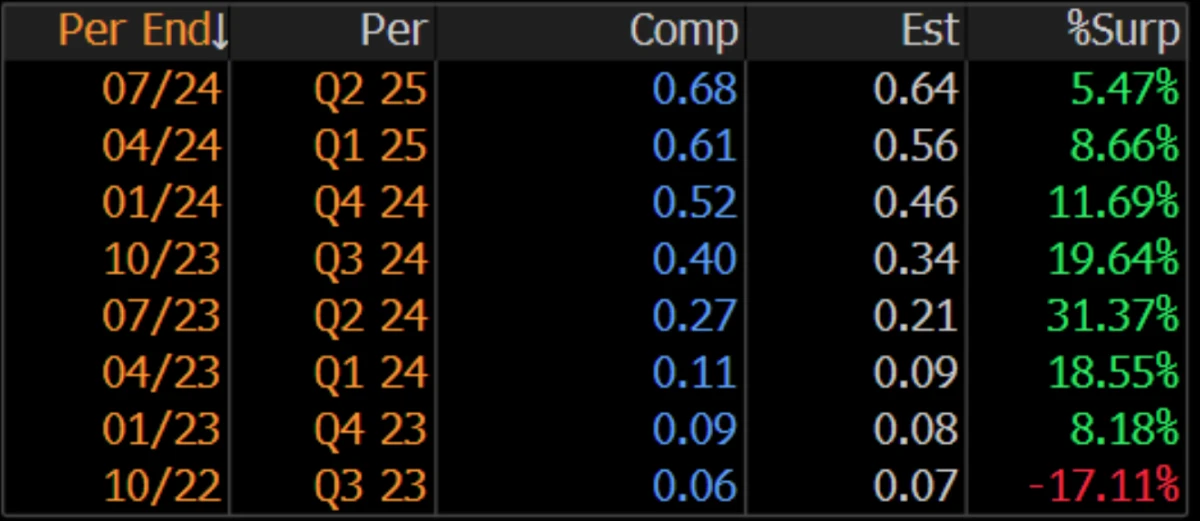
The Magnificent Seven mostly did their part with the exception of Amazon (sales) and Tesla (earnings) in contributing to the better-than-expected earnings season for the market.Despite much of the mega cap group’s constituents beating their estimates, the price reactions to their reports were largely negative. There are of course many factors that drive the day-to-day movement of the markets (such as the yen carry trade outlined earlier), but it’s an important reminder as to why diversification is key to a long-term investment strategy.While we maintain a belief that many of the stocks in the Magnificent Seven are well positioned for future performance, high valuations reflect high expectations for continued growth.In some cases, beating consensus expectations isn’t enough, investors conditioned to see double digit earnings beats can be underwhelmed by still strong results.Nvidia for instance provided an earnings beat of 5.47% for Q2 which, while above the consensus estimates, represented a smaller beat of expectations when compared to the previous several quarters.

Nvidia Earnings Surprises (Bloomberg)
The good news is that while lofty valuations may lead to volatility when these expectations are high and unmet, the drivers of a stock’s intrinsic value are still tied to the fundamentals and as long as these companies maintain their competitive advantages and execute, they may still grow into that price over time. Upside surprises when compared to expectations often imply growth being “pulled forward” to an early time horizon, while a miss relative to those expectations can mean that growth is pushed out further into the future.
Overall, we found the most recent reported earnings season to reflect positively on the stock market. Recent underperformance of the mega cap Magnificent 7 stocks has been noticeable, especially given their weak response to strong earnings announcements, but given the sizable outperformance of many of these stocks over both year-to-date and multi-year periods, we believe that there is very little indication that this is more substantial than a pause in a strong overall trend.
Seasonality
Of all the noted market abnormalities and observed seasonality trends in the history of stock market investing, perhaps the most widely discussed is the “September effect”. This being the observation that September has historically been the worst month for stock markets and one of the few that has shown a negative (albeit just slightly negative) return on average. It is true that since 1974 the S&P 500 has averaged a -1.2% return, but as with all things governing market behaviors and trends, there are important exceptions (as explained by Jonathan Levin of Bloomberg). For starters, over the past 50 Septembers the S&P 500 has fallen just 56% of the time (as Levin phrases it, slightly more often than a “coin flip”). There have also been plenty of months in that range where the market fared just fine or even produced a strong return. In 2010, September provided investors a return of nearly 9%, the strongest month of that year. 2019 (~1.9%), 2017 (~2%), 2013 (~3%), and 2012 (~2.5%) are some other recent examples of positive returning Septembers where investors likely wouldn’t have desired being on the sidelines.
When looking at a measure such as the median as opposed to the mean of September returns in the 50-year period, the negative drag of the month shifts significantly from -1.2% to -0.5%.This demonstrates the substantial impact of outliers on the data set. In the worst performing Septembers, the market is often already in a bear market preceded by negative performance months leading up to a worse September (the market in that month lost over -9% in 2022 and nearly the same in 2008 as examples).Comparing these periods to the present, a time when stocks continue to be in a bull market, is tenuous at best.The risk-reward dynamic of building a long-term investment plan off of something as arbitrary as the month of the year does not constitute a sound process in our point of view, when a multitude of other factors (market fundamentals, central bank monetary policy, and economic forces) play a much more convincing role in dictating future returns.
Conclusion
With the labor market signs of slowing, inflation reaching points close to target, and the Federal Reserve set to begin reducing interest rates, the market is nearing an important turning point.The magnitude of the Fed’s first cut and how Jerome Powell frames it in his presser will have a likely impact on market sentiment that could set up the trajectory of momentum for the 4th quarter.The continued pipeline of jobs data, inflation reports, and signals from corporate guidance will also be important clues as to whether the soft landing thesis remains base case for investors.
Our current view is one of caution but not heightened concern, as markets remain in a relative uptrend near their highs, have maintained healthy levels of earnings growth, and the economy itself appears to be heading towards an environment with a more supportive interest rate policy. Key risks to the market include the possibility of the labor market experiencing a more dramatic weakening than anticipated, with a sudden surge in layoffs across a broader array of sectors being the biggest indicator to watch for. A resurgence in inflation remains in our view an unlikely but fringe risk possibility. With the first Presidential debate receiving the spotlight this Tuesday evening, a rise in temporary volatility as a result of election concerns would be unsurprising but not indicative of the fundamental factors that drive long-term growth. Finally, the geopolitical environment remains one of heightened tensions with conflict in the Middle East and in Eastern Europe; further escalations in these regions remain clear risks to continue monitoring.
Need Some Help?
If you’d like some help from one of our CPAs or CERTIFIED FINANCIAL PLANNER (CFP®) advisors regarding this strategy and how it applies to you, the Rhame & Gorrell Wealth Management team is here to help.
Our experienced Wealth Managers facilitate our entire suite of services including financial planning, investment management, tax optimization, estate planning, and more to our valued clients.
Feel free to contact us at (832) 789-1100, [email protected], or click the button below to schedule your complimentary consultation today.
IMPORTANT DISCLOSURES:
Corporate benefits may change at any point in time. Be sure to consult with human resources and review Summary Plan Description(s) before implementing any strategy discussed herein.Rhame & Gorrell Wealth Management, LLC (“RGWM”) is an SEC registered investment adviser with its principal place of business in the State of Texas. Registration as an investment adviser is not an endorsement by securities regulators and does not imply that RGWM has attained a certain level of skill, training, or ability. This material has been prepared for informational purposes only, and is not intended to provide, and should not be relied on for, tax, legal or accounting advice. You should consult your own CPA or tax professional before engaging in any transaction. The effectiveness of any of the strategies described will depend on your individual situation and should not be construed as personalized investment advice. Past performance may not be indicative of future results and does not guarantee future positive returns.
For additional information about RGWM, including fees and services, send for our Firm Disclosure Brochures as set forth on Form ADV Part 2A and Part 3 by contacting the Firm directly. You can also access our Firm Brochures at www.adviserinfo.sec.gov. Please read the disclosure brochures carefully before you invest or send money.


