Should You Be Worried About the Yield Curve?
Market Indicators From The Yield Curve
One of the things that we have heard a lot about recently is something that has not been much of a consideration over the past 10 years – increasing interest rates and the flattening of the yield curve. With the ending of the Fed’s ZIRP era (Zero Interest Rate Policy), the US Treasury 10-year yield has doubled from 1.5% to 3.05%. During that same time, spread between 2 year and 10-year yield has narrowed from about 80bp to 44bp as of this writing.
Why is this important?
Over time, a flattening yield curve has been a fairly reliable indicator of oncoming recession. The bond market tends to look at this as a potential warning sign that inflation is increasing and that the Fed could be raising rates faster than the economy is growing, and thereby cause a recession.
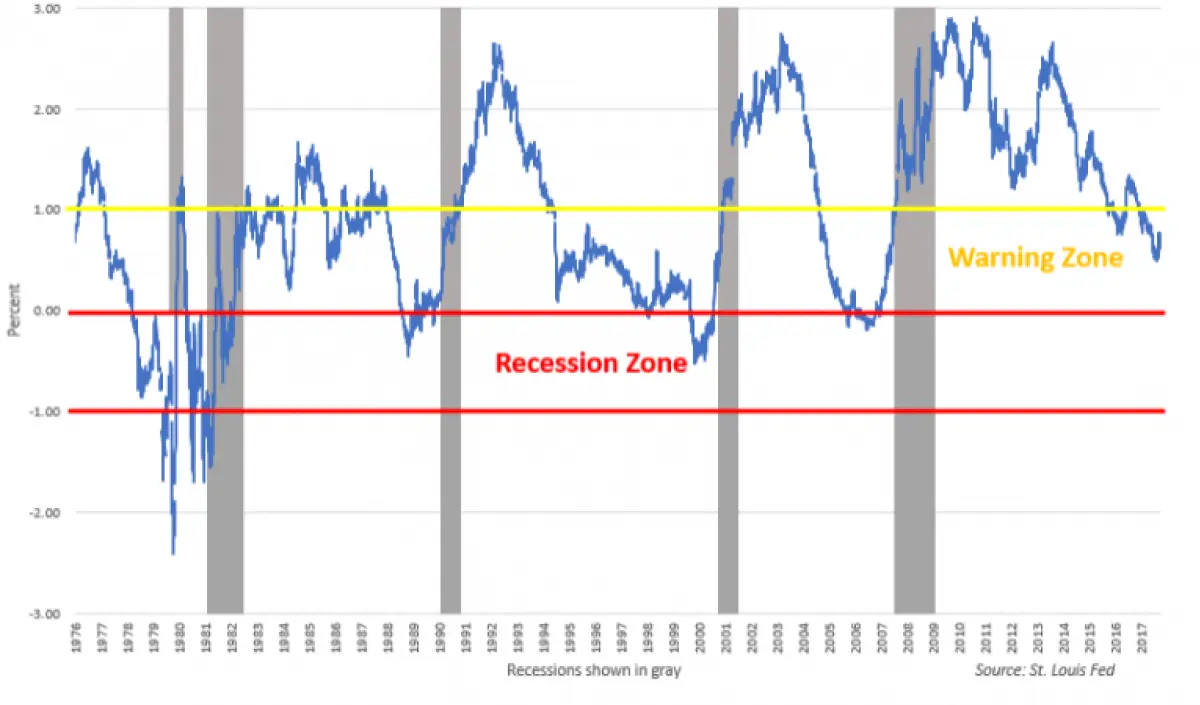
There have been five recessionary periods since 1980 and in each case the yield curve inverted – effectively predicting the oncoming recession. However, it is important to note that the period at which the recession occurred was on average 17 months after the inversion, with the longest period being almost 2 years from 2006 to 2008. The chart below shows the yield spread moving into the warning zone, and why this is making investors increasing skittish.
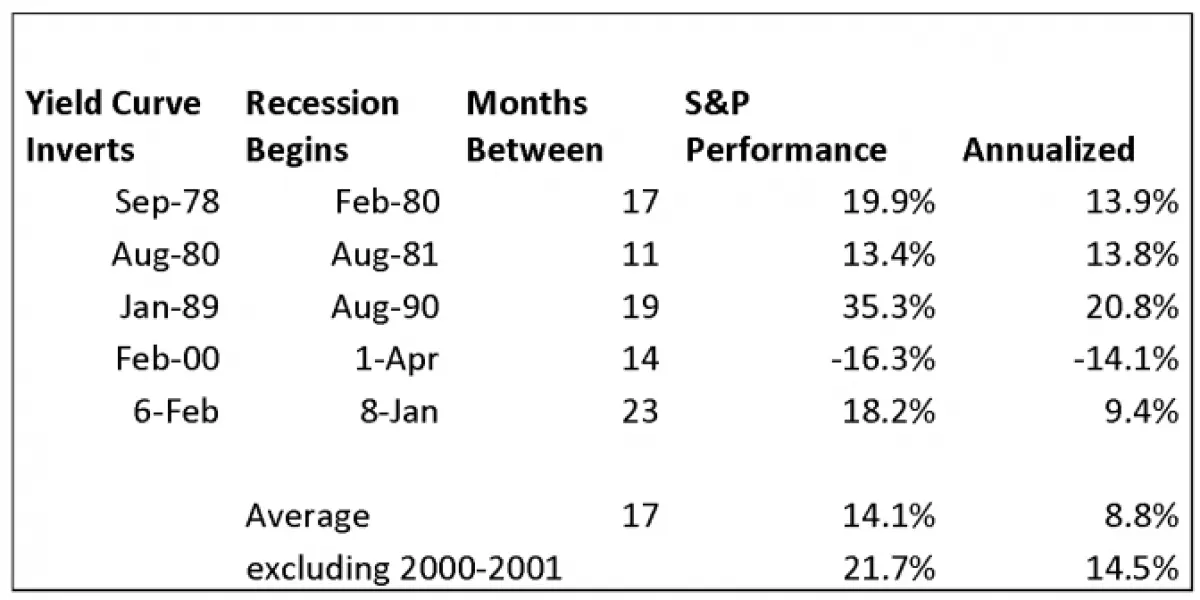
What is interesting to note is that the performance of the S&P during these interim periods before recession was positive. As seen in the table below, the average return for the S&P was approximately 8.7% on an annualized basis and was positive 4 out of 5 occurrences. An argument can be made that the extreme overvaluation of the tech bubble in 2000 made the yield curve analysis less important as an indicator, and if you take that year out the performance of equities becomes even more compelling.
What is different?
As nice as it would be to have one measure be a true economic predictor, unfortunately that is not the case. Yield curve flattening alone does not tell the entire story. We think there is a significant difference in HOW the curve is flattening.
That is to say, the curve is flattening not because 10-year Treasury yields are declining but because they are going up more slowly than the 2-year. This has something to do with the comparison of still low rates in Europe and Japan, but it has more to do with the underlying growth of the US economy. As we have said before, rising rates in a growth environment is not necessarily negative – as evidenced by the previous chart of S&P performance.
The more crucial factor for investors to consider is the prospect of higher inflation. In a growing economic cycle, inflation is offset by productivity gains, and the role of the Fed is to “steer” the economy by managing the level of short term rates. If inflation expectations are being managed, a flat yield curve can persist for an extended period. This was the case during 1994 – 1998. Whether or not inflation is increasing is a much longer discussion, but for the record we believe there are significant deflationary forces globally that make inflation less of a concern. However, what is more important to this discussion is what the numbers actually show, rather than what we believe.
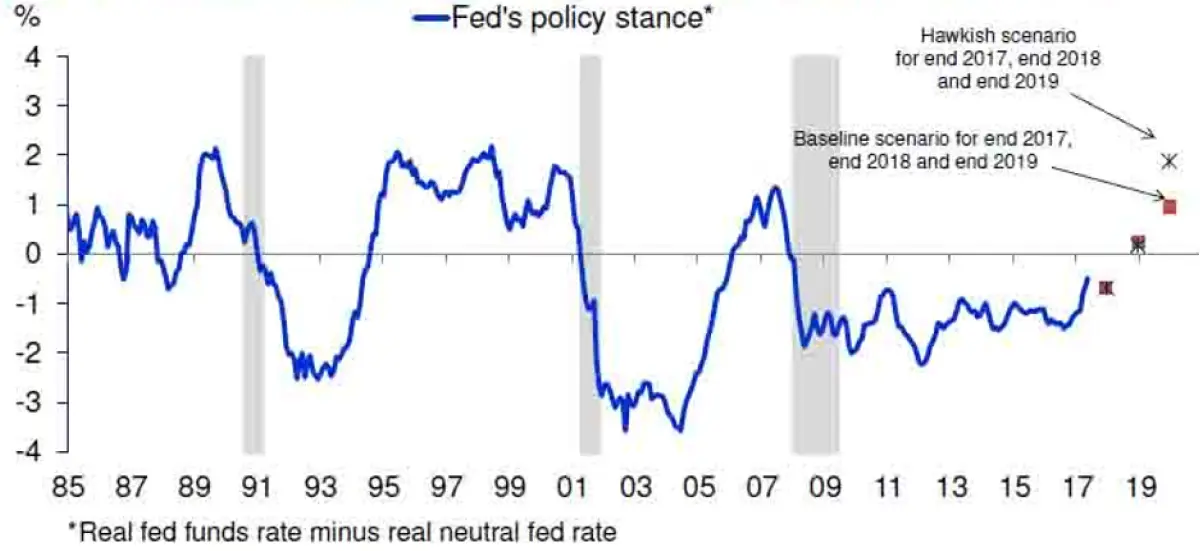
The chart above shows the Fed Funds “real rate” (Fed Funds – inflation) versus the Fed “neutral “target rate. This incorporates both the real measure of current inflation and the expectation of future inflation expectations. What this tells us is that when inflation is priced in, we are not nearly as close to a recession signal as the flattening yield curve would suggest. In fact, we are not even at the Fed breakeven point yet, which leads us to believe that current recessionary fears are overblown.
Since the 2008 financial crisis which led to the “money printing” policies of QE, and now the non-rules-based reversal of QE (also called quantitative tightening), investors have literally been flying semi-blinded when compared to previous years. The old yardsticks have not been applicable due to the extraordinary monetary policies of the past ten years. We are moving back to a more normalized monetary policy and economic environment, which should follow the more traditional path.
At the end of the day, our mission is to provide our clients with the best risk-adjusted return that is available across the investment landscape. At some point in the future, we will expect to see those risk measures move our overall investment posture down the risk curve. However, based upon the current yield flattening discussion, we do not see that happening anytime soon.
Need Some Help?
If you’d like some help from one of our CPAs or CERTIFIED FINANCIAL PLANNER (CFP®) advisors regarding this strategy and how it applies to you, the Rhame & Gorrell Wealth Management team is here to help.
Our experienced Wealth Managers facilitate our entire suite of services including financial planning, investment management, tax optimization, estate planning, and more to our valued clients.
Feel free to contact us at (832) 789-1100, [email protected], or click the button below to schedule your complimentary consultation today.
IMPORTANT DISCLOSURES:
Corporate benefits may change at any point in time. Be sure to consult with human resources and review Summary Plan Description(s) before implementing any strategy discussed herein.Rhame & Gorrell Wealth Management, LLC (“RGWM”) is an SEC registered investment adviser with its principal place of business in the State of Texas. Registration as an investment adviser is not an endorsement by securities regulators and does not imply that RGWM has attained a certain level of skill, training, or ability. This material has been prepared for informational purposes only, and is not intended to provide, and should not be relied on for, tax, legal or accounting advice. You should consult your own CPA or tax professional before engaging in any transaction. The effectiveness of any of the strategies described will depend on your individual situation and should not be construed as personalized investment advice. Past performance may not be indicative of future results and does not guarantee future positive returns.
For additional information about RGWM, including fees and services, send for our Firm Disclosure Brochures as set forth on Form ADV Part 2A and Part 3 by contacting the Firm directly. You can also access our Firm Brochures at www.adviserinfo.sec.gov. Please read the disclosure brochures carefully before you invest or send money.


