
Market Update – August 2026
As we approach the end of summer, August has seen a continued theme of stock market resiliency. Markets remain just off their highs for the month, displaying strong continued momentum buoyed by the fundamental underpinning of higher-than-expected double-digit earnings growth. The strength of earnings and investor risk appetite has led the market higher despite numerous economic, geopolitical, and thematic narrative driven obstacles.
Each wobble – whether from the continued war in Iran, rising bond yields, a weaker labor market, or variable inflation concerns – has seen investors buy the dip. The market’s response to this broad array of obstacles suggests that investors believe that current corporate profitability trends will be longer-lived than drags resulting from the outlined risks.
This described contrast in market expectations is displayed below through the following chart showing forward S&P 500 EPS and the price of oil implied through the 12-month WTI futures strip. Shown in the chart is an expectation of continued growth in corporate earnings while the impacts of the Strait of Hormuz’s closure moderates over time.
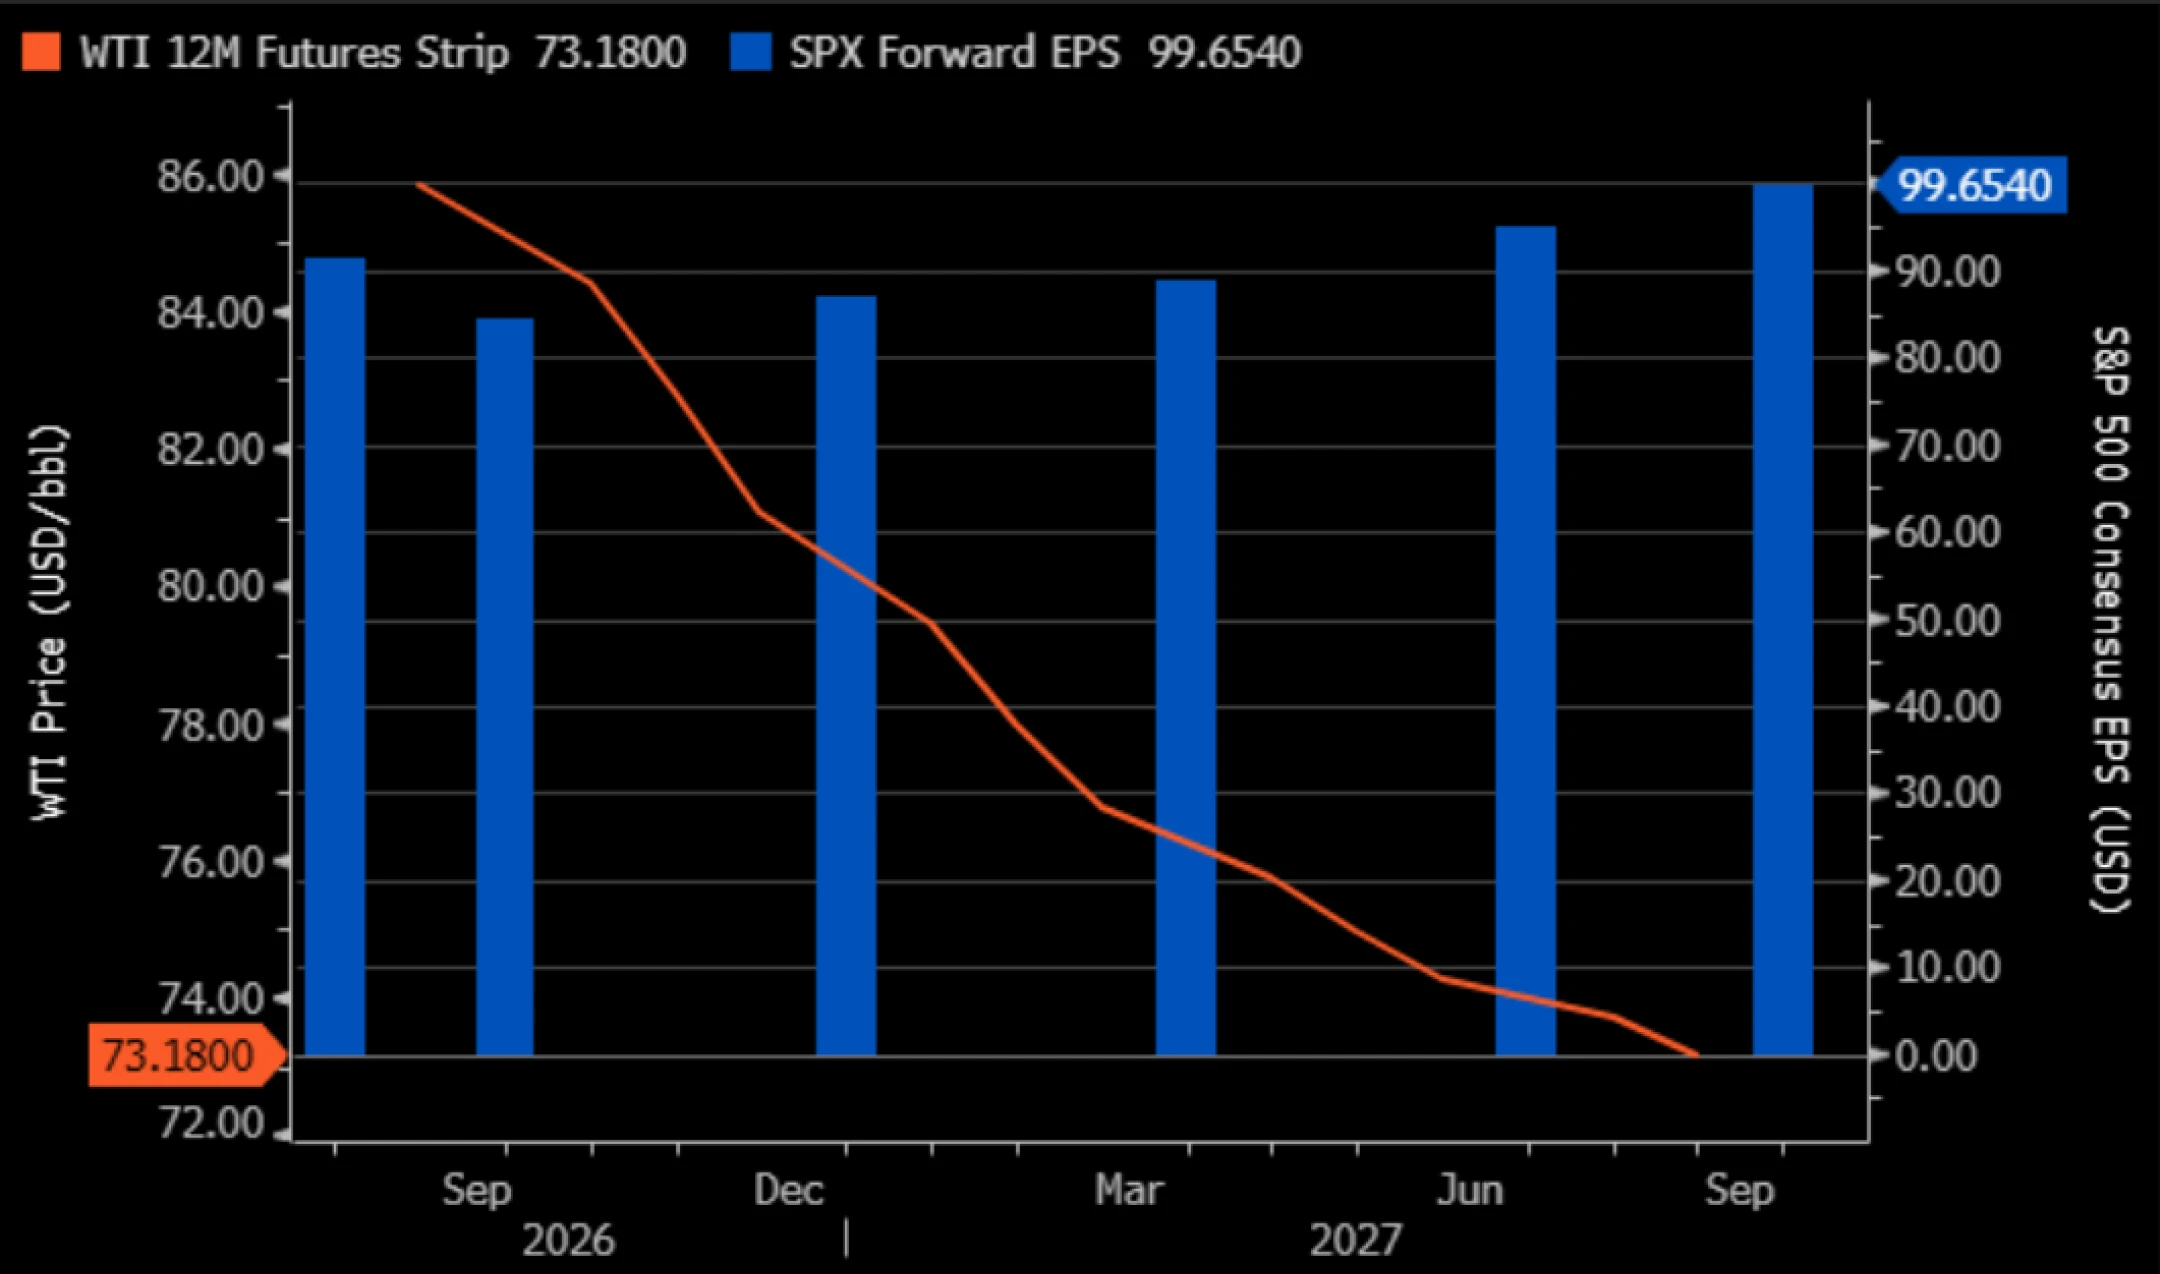
S&P 500 Forward EPS Estimates vs Price of WTI 12M Futures STRIP Over Time (Bloomber
Both the spot price and blended forward prices have rallied from July’s lows but remain below the highs established in the spring. This occurred despite the ceasefire having expired on Monday without a peace agreement or extension being reached; furthermore, neither side has displayed an intention to extend the expired deal to this point.
Traditional metrics used to monitor traffic through the Strait of Hormuz, such as detected through automated transponders, remains at a halt. Total transponder-recorded tanker crossings remain at 5 per day while Eastbound tanker traffic is at 0; normal traffic once sat in the 60-80 tanker crossing per day range. This normal traffic equated to 20 million barrels a day and roughly a fifth of the world’s oil supply.

Change to Shipping Traffic in the Strait of Hormuz Over Time (Bloomberg)
If the numbers shown above told the whole story, the ramifications for the global economy would be disastrous and the price of oil (both spot and futures) would be significantly higher.
Global economic players have displayed a high degree of creativity, developing various means to address supply chain crisis that was expected to have much more severe consequences than it has to this point. An unprecedented worldwide coordination in strategic reserve releases, China’s extreme export restrictions, and a rise in “alternative” means of oil distribution have all contributed to dulling some of the crisis’s impacts.
According to Bloomberg’s reporting, Middle Eastern oil producers are continuing to move large volumes of oil out of the Persian Gulf by a combination of ferrying oil to the Gulf of Oman through “dark tankers” operating without their transponders or via pipeline workarounds; the results have been volumes running higher than market estimates of 4 million barrels a day.
Concurrent with this report, the US Energy Secretary Chris Wright said that in just the last week 9 million barrels a day had crossed the Strait. If these numbers are accurate, they reflect a substantial level of effectiveness from the outlined distribution channels described above.
While the actions taken to counteract the Strait’s closure have been an effective alleviation of an even worse potential crisis, it cannot work in perpetuity. The efforts neither hold the intention nor have the ability to be a long-term solution to the crisis. With WTI nearing $90 and Brent nearing $95 per barrel as well as the Treasury market’s recent climb in yields, there are signs that the market may be losing its patience and faith that further easing of conflict tensions is on the immediate horizon.
Market Summary
As mentioned in our introduction, however, the stock market for its part does not seem too bothered. While recent leadership has gone through several undulations, the S&P 500 has returned 13.40% on the year and remains within about a percentage point of its all-time high established earlier in the month.
The leadership in the stock market is not as simple as the “growth” versus “value” paradigm that has often been observed the last few years; the value tilted Dow Jones and growth tilted NASDAQ are within arm’s reach of one another with the S&P 500 in between. Small cap stocks continue to lead their large cap counterparts, perhaps surprising given the year-to-date rise in Treasury yields. The combination of A.I. thematic tailwinds and energy equity resurgence has buoyed small caps higher despite financially tighter conditions.
Similarly, emerging market equities continue to outperform stocks in the U.S. and international developed markets. The Russell 2000 (small caps) and MSCI Emerging Markets indices have returned ~23% and ~20% respectively on the year.

The two sectors leading the broader market on the year in energy and technology exemplify the thematic duopoly dominating markets. Energy, led by oil and gas, represents the crisis in the Strait of Hormuz while technology most represents the momentum from the artificial intelligence segment. The second tier of leadership in industrials (~18% YTD) and materials (~15.7% YTD) has tie-ins to the broader A.I. buildout and the broader supply chain issues resulting from the conflict in Iran.

While the risks to markets have been prominently on display, the steady climb higher in spite of them has not been without fundamental merits. With the bulk of S&P 500 companies (466 of them) having reported for the most recent quarter, the index is on pace for a number of milestones. According to FactSet, it will have been:
- The seventh consecutive quarter of double-digit year-over-year (YoY) earnings growth
- The second consecutive quarter of YoY earnings growth above 25%
- The blended YoY growth rate nearing 50% would mark the highest growth rate since Q2 2021
Earnings surprises have been positive across the board, but massive beats by Amazon (~214%) and Alphabet (~213%) have skewed results above expectations for both their respective sectors (Consumer Discretionary 87.6% beat, Communications ~96.6% beat) and the broader index (28.4%).
Economic Update
While robust corporate earnings continue to provide a strong fundamental backdrop, the near-term macroeconomic picture has begun to show signs providing an argument of a cooling expansion. These signs this past month included sticky inflation showing genuine signs of abating, a decelerating labor market, and slowing output. While the Federal Reserve maintains a cautious stance, the U.S. Treasury made a notable tactical intervention by doubling its long-dated Treasury buyback operations.
Price pressures once again provided evidence of a gradual downward trajectory. The June PCE report, released in late July, showed headline PCE falling to 3.7% year-over-year (YoY) from May’s 4.1%, while core PCE ticked down to 3.3% YoY from 3.4%. July’s inflation figures provided mixed results of short-term acceleration but a broader continued weakening in year-over-year inflation.
The July CPI report came in largely as anticipated: headline CPI rose a modest 0.1% month-over-month (MoM), bringing the annual rate down to 3.4%. Core CPI increased 0.2% MoM, placing the 12-month core rate at 2.5%.
The inflation environment can continue to be described as one of “yes, if”. As in, yes, the latest data continues to support a Fed holding rates, but only if the inflationary pressure stemming from the Strait of Hormuz can be contained and ultimately diminished.
Displaying the difficult inflation paradigm, fixed income markets have not bought in to the latest inflation data pricing progress, the 30-year Treasury yield surged to a 19-year high of 5.34%, raising widespread concerns over rising borrowing costs across corporate debt, consumer mortgages, and national deficit servicing. In response to tight liquidity and potentially dwindling organic demand, the U.S. Treasury doubled its buyback operations for 10- to 30-year debt from $2 billion to $4 billion per operation.
This action injects an additional $14 billion in liquidity support, lifting total planned repurchases for the quarter from $69 billion to $83 billion. While this intervention highlights underlying market fragility, it demonstrates the tools available to federal authorities to stabilize long-end debt and manage sovereign budget pressures.
Simultaneously, broader growth metrics paint the picture of a difficult labor market. July nonfarm payrolls unexpectedly contracted by 23,000 jobs, missing expectations of an 80,000 gain. Although unemployment edged down slightly to 4.1% from 4.2% in June, the decline was driven by labor force participation dropping to a 5-year low of 61.4% rather than robust hiring.
Economic output reflected a similar deceleration, with Q2 GDP advance estimates coming in at 1.5% annualized, down from 2.1% in Q1. The Atlanta Fed’s GDP Now estimate currently tracks growth for Q3 modeling at 4%, but this is above the Blue Chip estimates ~2.5% and has been trending down since it began tracking this month.
Retail sales for July saw a surprising downward miss, showing a MoM decline of -0.6% versus the survey’s estimate of a 0.1% increase. Consumer spending saw acceleration in the Q2 GDP report relative Q1, as did business fixed investment (signs of the A.I. buildout). As a consumption-oriented economy, it will be critical to U.S. growth prospects for the consumer to bounce back in the coming months.
This combination of cooling inflation and softer growth places the Federal Reserve in a difficult spot as it pertains to policy direction.
The FOMC voted 9–3 to hold policy rates steady, with three dissents favoring a 0.25% rate hike. However, given the sharp miss in labor data, further tightening expectations have plummeted: prediction markets now price an 85% probability of zero additional hikes this year, Fed futures caps potential tightening at a single hike in 2026, and major investment banks project any further action could be delayed as late as December 2026.
Ultimately, we maintain a posture that the bar to raise rates by the Fed remains high and will likely hinge on whether the conflict in Iran that is driving headline inflation higher moves into at minimum a more moderate state that allows for renewed flow of tanker traffic. The longer the conflict lasts, the more extreme the outcomes become ranging from high inflation to economic contraction.

Trajectory of Federal Funds Rate as Implied by Interest Rate Futures (Bloomberg)
Conclusion
As we move toward the end of summer, the current market environment remains fundamentally constructive. Strong corporate earnings, resilient investor risk appetite, broad participation across equity markets, and continued investment tied to artificial intelligence have provided meaningful support despite an increasingly complicated backdrop.
The market has been willing to look through a number of developing risks, including the ongoing war in Iran, elevated oil prices, rising Treasury yields, cooling labor market conditions, and an uncertain inflation outlook. This resilience should not be dismissed, as the underlying earnings picture remains strong, but neither should the risks be ignored. Markets have treated many of these challenges as temporary or manageable; however, the longer these pressures persist, the greater the potential for them to affect inflation, consumer spending, corporate profitability, and broader economic growth.
We also enter a period that has historically warranted additional caution. The upcoming midterm elections introduce another source of political and policy uncertainty, while market seasonality during the late summer and early fall has historically been less favorable and can contribute to periods of increased volatility.
Neither factor alone necessarily suggests that the current bull market must come to an end, but both reinforce the importance of maintaining discipline when market sentiment and valuations remain elevated. As always, our focus is not on attempting to predict every short-term market movement, but rather on continuously monitoring the economic, geopolitical, and market environment for changes that could alter the broader investment outlook.
We remain dedicated to actively evaluating these developments and making thoughtful adjustments when conditions warrant. While the current backdrop continues to support a constructive long-term view, appropriate diversification remains critical given the wide range of possible outcomes across asset classes and sectors.
Just as importantly, portfolios should remain aligned with each investor’s individual objectives, time horizon, and risk tolerance. The strength of today’s market should provide confidence, but it should not encourage complacency. By balancing participation in areas of opportunity with prudent risk management and diversification, we believe investors can remain positioned to benefit from continued expansion while also maintaining the flexibility necessary to navigate the risks that may emerge in the months ahead.
Need Some Help?
If you’d like some help from one of our CPAs or CERTIFIED FINANCIAL PLANNER (CFP®) advisors regarding this strategy and how it applies to you, the Rhame & Gorrell Wealth Management team is here to help.
Our experienced Wealth Managers facilitate our entire suite of services including financial planning, investment management, tax optimization, estate planning, and more to our valued clients.
Feel free to contact us at (832) 789-1100, [email protected], or click the button below to schedule your complimentary consultation today.


IMPORTANT DISCLOSURES:
Corporate benefits may change at any point in time. Be sure to consult with human resources and review Summary Plan Description(s) before implementing any strategy discussed herein.Rhame & Gorrell Wealth Management, LLC (“RGWM”) is an SEC registered investment adviser with its principal place of business in the State of Texas. Registration as an investment adviser is not an endorsement by securities regulators and does not imply that RGWM has attained a certain level of skill, training, or ability. This material has been prepared for informational purposes only, and is not intended to provide, and should not be relied on for, tax, legal or accounting advice. You should consult your own CPA or tax professional before engaging in any transaction. The effectiveness of any of the strategies described will depend on your individual situation and should not be construed as personalized investment advice. Past performance may not be indicative of future results and does not guarantee future positive returns.
For additional information about RGWM, including fees and services, send for our Firm Disclosure Brochures as set forth on Form ADV Part 2A and Part 3 by contacting the Firm directly. You can also access our Firm Brochures at www.adviserinfo.sec.gov. Please read the disclosure brochures carefully before you invest or send money.



![[Webinar Replay] Maximizing Your Business Sale: Strategies for Success](https://rgwealth.com/wp-content/uploads/2024/06/Insights-Maximizing-Your-business-Sale_-Strategies-for-Success-Webinar-480x270.webp "[Webinar Replay] Maximizing Your Business Sale: Strategies for Success")